
CHOOSING A QUALITATIVE DATA ANALYSIS (QDA) PLAN
August 20, 2019
Factor Analysis – Definition, Methods & Applications | StatsWork
August 24, 2019SEM Using AMOS – Guide to Structural Equation Modeling with AMOS
Meta Analysis Service
Recommended Reads
Contact us
SEM Using AMOS – Guide to Structural Equation Modeling with AMOS
In modern times, the complexity of research requires the use of complex statistics to interpret relationships. The researcher might want to study several variables together while taking into account the error terms and indirect impacts. For this reason, structural equation modeling is used to solve the problem. With the use of structural equation modeling and AMOS, the researcher may create the best model possible.
What Is Structural Equation Modeling?
The process of structural equation modeling is based on analyzing relationships between latent and observed variables. In this case, observed variables are measurable while latent ones are unmeasurable concepts, including customer satisfaction, employee engagement, brand loyalty, and academic performance, among others.
This technique combines factor analysis and regression analysis in a single model to provide a comprehensive view of a number of relationships in the system under scrutiny. For this reason, SEM can prove to be extremely useful when dealing with research in social sciences, healthcare, business studies, marketing, psychology, and education.
Why Is SEM Important in Research?
One of the main problems faced by any researcher is how to understand the interconnections between different variables.
However, SEM helps overcome such problems by providing an opportunity to verify the theory models and to see whether they are supported by the obtained data. In addition, SEM takes into consideration measurement errors, and therefore, gives more precise results that allow drawing stronger conclusions. Researchers will be able to find more answers regarding causal relationships.
AMOS Software Description
AMOS stands for the Analysis of Moment Structures and represents a software package aimed at carrying out Structural Equation Modeling. AMOS is one of the most popular tools due to its user-friendly interface based on graphics, where researchers can easily create various models.
AMOS works perfectly in combination with SPSS and has a number of benefits for modeling, estimation, and model fit evaluation. With the help of AMOS, even non-programming specialists can easily perform SEM.
SEM Model Using AMOS
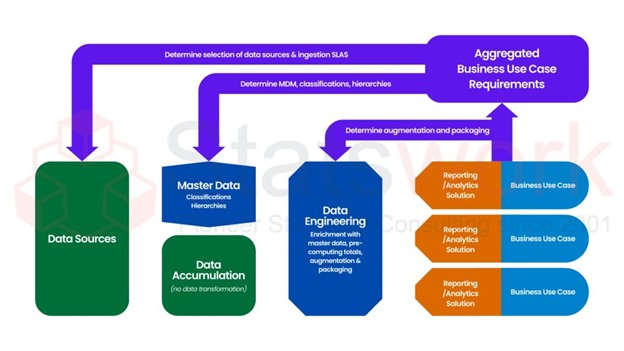
SEM modeling first starts with formulating the conceptual/theoretical model. The variables under analysis and the relations between them are identified before collecting any data. Data is then collected and loaded into the software for further analysis.
Through the graphical user interface provided by the software, researchers can develop path diagrams. The data collected from variables is analyzed and the relationship strength is estimated.
At the end of the process, the output will include such statistics as regression coefficient, factor loading, covariance estimates and model fitness measures.
Available Estimation Methods in AMOS
AMOS provides a number of estimation methods that cater to various research needs. The decision about which estimation method to use depends on the nature of the dataset involved.
Unweighted Least Squares (ULS) can be employed in order to minimize residual errors. When the residual errors are correlated and more precise estimation is needed, GLS method should be used. If you have a large sample of non-normally distributed data, ADF method might be preferred in covariance structure analysis.
Selecting the appropriate estimation method is essential for obtaining valid and reliable SEM results.
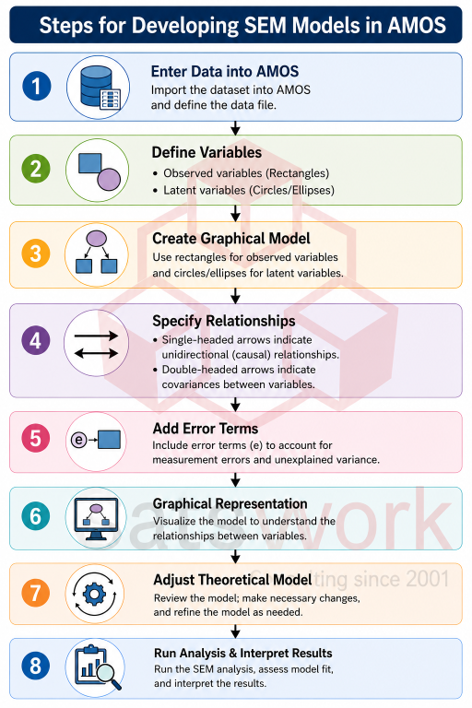
Steps Taken in Creating Structural Equation Modeling in AMOS
Import the Dataset Into AMOS: Start off with importing the data set into AMOS software, and all the variables that will be needed in the model must be imported.
Define the Variables: This refers to defining the variables to be used in the model as follows:
- Rectangles are used to represent observed variables.
- Ellipses are used to represent latent variables.
Show Relationships Between the Variables: The relationships between the variables can be indicated using arrows as follows:
- Unidirectional or causation relationship is shown using single-headed arrows.
- Bivariate relationships are shown using double-headed arrows.
Indicate the Errors in the Model: These are included in order to take care of any error in the measurements in the model.
Label the Variables: All the variables should be labeled properly and correctly.
Graphical Representation in AMOS Program
With the help of a graphical representation provided by AMOS, researchers will be able to see the relationship between variables, adjust the theoretical model they have and make necessary changes.
Analyzing SEM Output in AMOS
Upon completion of SEM analysis using AMOS program, researchers get an output in graphical and textual formats. It will give them useful information about the proposed model.
Among the most helpful pieces of information, researchers will find data normality, number of observed and latent variables, path coefficients, fit indices, and modification indices provided by AMOS.
Conclusion
Structural Equation Modeling has evolved into one of the best methods in statistics for evaluating sophisticated research paradigms. The capacity to explore several relationships, assess latent variables, and minimize measurement error makes it indispensable for researchers in today’s time. Given its simple-to-understand graphics and advanced analytics, AMOS is a blessing for researchers seeking to develop meaningful and reliable models. Regardless of whether one conducts research within academics, business, healthcare, or the social sciences, SEM through AMOS can provide important information on which sound decisions can be based.
Through its capacity to deal with latent variables and errors in measurement, SEM allows more valid and meaningful results to be drawn from the data. Those researchers who require guidance for their work can seek Statswork Data Analysis Services that provide professional help in SEM via AMOS.
Reference:
- Chitladaporn, P., & Kanchanawongpaisan, S. (2024). A comprehensive review of a beginner’s guide to structural equation modeling: Enhancing accessibility for new researchers. วารสาร สห วิทยาการ มหาวิทยาลัย ชิน วัตร, 1(3), 13-21. https://li04.tci-thaijo.org/index.php/mjs/article/view/3216
- Kruasom, T. K. T., Ngeoywijit, S., Sopapol, S., Kosanlawit, T., Sangwarn, S., & Adthajak, P. (2025). FROM FOUNDATIONS TO FRONTIERS: THE DEVELOPMENT AND FUTURE OF STRUCTURAL EQUATION MODELING (SEM). 22(2), 129-149. https://so06.tci-thaijo.org/index.php/umt-poly/article/view/287292
- UGD, M., & Lu, W. (2026). Review of structural equation modelling (SEM) application in construction management. Engineering, Construction and Architectural Management, 33(5), 4098-4118. https://www.emerald.com/ecam/article-abstract/33/5/4098/1259954/Review-of-structural-equation-modelling-SEM?redirectedFrom=fulltext