
- Services
- Data Analysis services
- Sample Work
Data Analysis services
- Secondary Qualitative Research Services
- Secondary Quantitative Research Services
- Meta-Analysis Research services
- Sample Work
Meta-Analysis Research Services
- Data Collection Services
- Sample Work
Data Collection Services
- Statistical & Biostatistics services
- Sample Work
Statistical Programming & Biostatistics services
- Data Management Services
- Sample Work
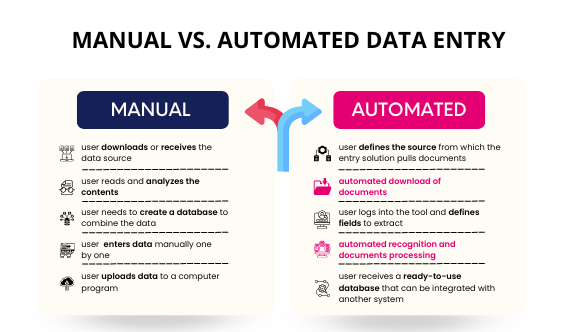
Data Management Services
- Research methodology services
- Sample Work
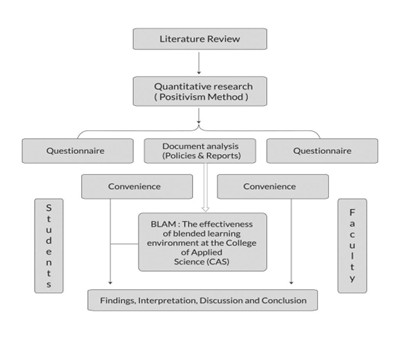
Research methodology services
- Tool Development Services
- Sample Work
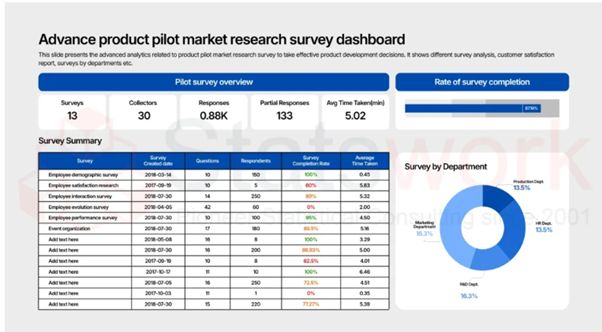
Tool development services
- Statistical Interpretation services
-
Statistical Interpretation services
- Sample Work
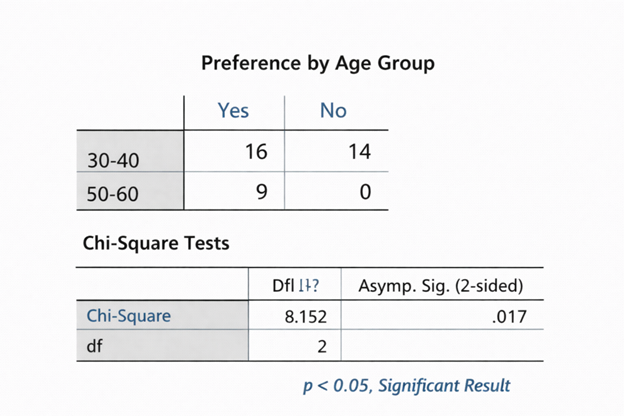
Statistical Interpretation services
-
- Sample Size Calculation Services
-
Sample Size Calculation Services
- Sample Work
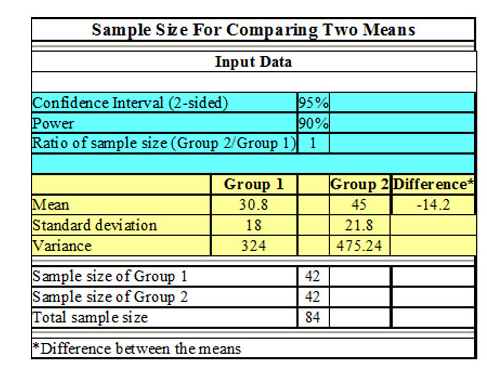
Sample Size Calculation Services
-
- AI & ML Services
-
Artificial Intelligence and Machine Learning Services
- Sample Work
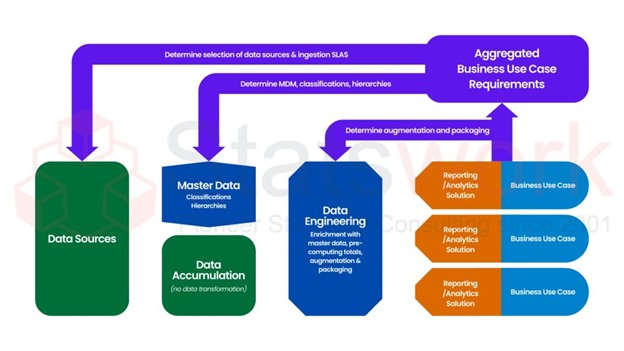
Artificial Intelligence and Machine Learning Services
-
- Meaningful Visualization Services
- Thought Leadership Services
- Report Generation Services
-
Report generation Service
- Sample Work
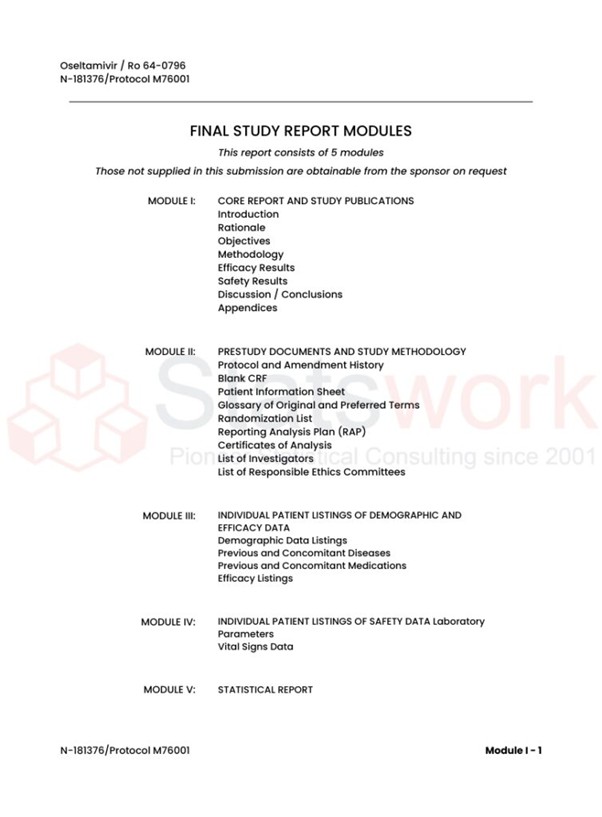
Report generation Services
-
- Data Analysis services
- Industries
- About Us
- Blog
- Insights
- Contact Us
- Services
- Data Analysis services
- Sample Work
Data Analysis services
- Secondary Qualitative Research Services
- Secondary Quantitative Research Services
- Meta-Analysis Research services
- Sample Work
Meta-Analysis Research Services
- Data Collection Services
- Sample Work
Data Collection Services
- Statistical & Biostatistics services
- Sample Work
Statistical Programming & Biostatistics services
- Data Management Services
- Sample Work
Data Management Services
- Research methodology services
- Sample Work
Research methodology services
- Tool Development Services
- Sample Work
Tool development services
- Statistical Interpretation services
-
Statistical Interpretation services
- Sample Work
Statistical Interpretation services
-
- Sample Size Calculation Services
-
Sample Size Calculation Services
- Sample Work
Sample Size Calculation Services
-
- AI & ML Services
-
Artificial Intelligence and Machine Learning Services
- Sample Work
Artificial Intelligence and Machine Learning Services
-
- Meaningful Visualization Services
- Thought Leadership Services
- Report Generation Services
-
Report generation Service
- Sample Work
Report generation Services
-
- Data Analysis services
- Industries
- About Us
- Blog
- Insights
- Contact Us
Using Statistics Effectively in Business Research?
Meta Analysis Service
- Why Statistics Matter: Moving Beyond Intuition
- The Four-Stage Framework for Statistical Business Research
- Core Statistical Methods: Applications in Business Analytics
- Statistical Sampling for Compliance & Auditing
- Real-World Business Applications: From Theory to Practice
- The Business Case: Why Your Organization Needs This Now
- Transform Your Business Through Statistics
- Ready to Become Data-Driven? Let's Transform Your Business With Statswork.
Recommended Reads
Contact us
Summary:
Firms that are utilizing the power of statistics in conducting business research reap multiple benefits compared to their competitors. The data can help improve processes and make the best choices to increase profits. In this guide, you will discover how to implement applied statistics in regression analysis, auditing, and financial forecasting. We at Statswork will assist you in gaining insight from your data to make faster decisions and improve your business processes.
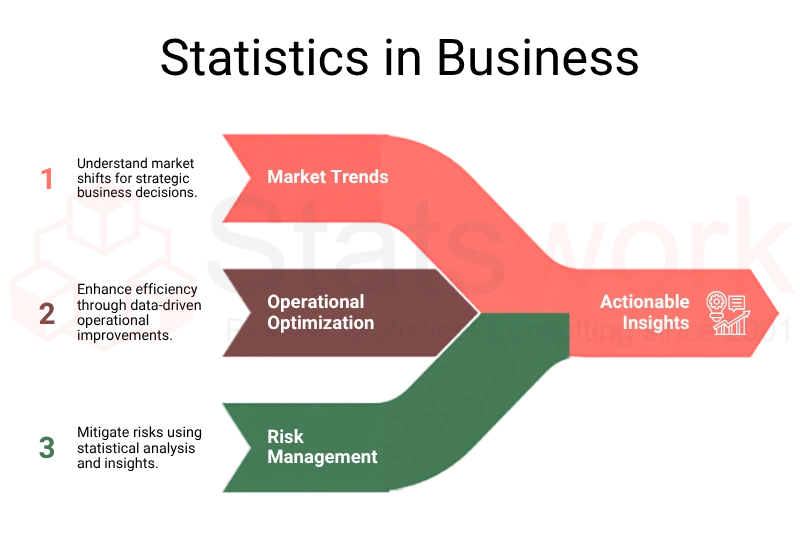
In today’s competitive business landscape, organizations that implement statistics in business research gain decisive competitive advantages. Statistical methods enable data-driven decision-making, providing measurable business value and market leadership. Businesses that are more competitive in nature use statistical data to gain insight into the problems they encounter at work and solve them using advanced applied statistics and business analytics.
Merely collecting data is insufficient; what matters is how you use it. This guide reveals how to apply statistics for business research correctly to ensure that any organization uses data confidently and strategically.
Why Statistics Matter: Moving Beyond Intuition
Decisions made without statistical backing are as risky as navigating blindfolded. Studies have shown that management based on statistical decision making is more effective than that of intuitive or assumed decisions [1]. In fact, statistics in finance and economics have become indispensable, whether in the analysis of market trends, the assessment of financial performance, or the evaluation of compliance with regulatory standards.
The compelling truth is that organizations which make decisions based on data are reporting:
- Improvements in operating efficiencies
- Some reduction in decision-making cycles
- Measurable cost savings through optimized resource allocation across departments
When properly applied, statistical methods enable businesses to:
- Identify hidden patterns in market data
- Predict future trends with higher accuracy
- Mitigate risks through evidence-based planning
- Allocate resources optimally across departments
The Four-Stage Framework for Statistical Business Research
Implementing statistics effectively requires a structured approach [1]. Organizations should follow this practical framework:
| Stages | Target | Action |
| 1. Problem Recognition | Identify what to solve | Collect and analyze past data |
| 2. Setting Up Research Objectives | Formulate clear objectives | Maintain connection between statistics and business |
| 3. Analysis of Alternatives | Evaluate various options | Conduct regression analysis and statistical modeling |
| 4. Implementation and Control | Conduct and control the process | Measure performance continuously |
This systematic approach transforms statistical analysis from theoretical exercise into practical business advantage.
Core Statistical Methods: Applications in Business Analytics
Regression Analysis for Performance Prediction
One of the most powerful statistical methods in business research is regression analysis. This approach correctly used can explain relationships between dependent and independent variables that affect business processes. For example, regression modeling in economic research is a popular tool among financial analysts who study the connection between certain variables and company performance. When teaching other advanced researchers, it is crucial to highlight that multicollinearity—the correlation between independent variables—should be taken seriously during the analysis. [3].
Statistical Sampling for Compliance & Auditing
For organizations that perform complicated, multilayered processes, utilizing statistical sampling can aid in gaining statistical accuracy without having to run through all of the processes. Statistical sampling could be used in industries where a large amount of contract auditing is required for quality control [2]. This approach is particularly valuable in:
- Financial auditing (contract verification)
- Quality assurance (process monitoring)
- Regulatory compliance (legal requirements)
Financial Performance Analysis
Recent studies on economics showed that using statistical models can improve financial forecast accuracy. Insurance companies and financial institutions that apply statistical methods to estimate performance correctly account for a higher number of accurate predictions and better risk management [4].
Real-World Business Applications: From Theory to Practice
Application 1: Auditing & Compliance
Scenario: A global enterprise must verify contract compliance across 500+ vendor agreements annually while managing audit costs.
Solution: Implementing statistical sampling methodology [2] instead of comprehensive audits:
- Reduces audit costs by 60-75%
- Maintains statistical validity through rigorous sampling techniques
- provides statistically defensible evidence to support compliance assessments [2]
Outcome: Management makes informed compliance decisions backed by mathematical rigor, not assumptions.
Application 2: Forecasting Financial Performance
Scenario: An insurance company must predict policy performance amid volatile market conditions.
Solution: Use of Multivariate Regression Analysis:
- Key drivers of performance determined
- Considers interdependencies [3]
- Produces reliable forecasts for strategic planning
Outcome: Leadership confidently allocates resources based on statistical projections, not gut feelings.
Application 3: Departmental Coordination
Scenario: There is a conflict of interest between production, marketing, and finance departments.
Solution: Business analytics using operational research to synchronize goals:
- Statistics reveal the trade-offs and optimal solutions between departments
- Objective decision-making
- Organizational effectiveness through synchronization
The Business Case: Why Your Organization Needs This Now
Data-driven organizations enjoy measurable advantages:
- Faster decision cycles: Statistics help to make decisions faster
- Reduced risk: Statistics help to make better decisions thus reducing the risk of bad decisions
- Efficient allocation: Statistics helps to utilize resources efficiently
- Competitive advantage: Statistics can give an organization an edge over its competitors
- Stakeholder confidence: Better decisions made using statistics increases confidence of stakeholders in the organization
Your Next Steps: Implementing Statistical Excellence
Immediate Actions:
- Audit existing processes – identify decisions that are currently being made without sufficient statistical backing
- Define research objectives – ensure that statistical objectives are aligned to business objectives
- Upskill – train existing staff in statistical and business analysis disciplines
- Evaluate – measure the business impact of your statistical process improvements
- Expand – roll out successful initiatives more widely after initial testing
Transform Your Business Through Statistics
The companies who rule their respective industries are not lucky but systematic. They know very well that statistics in business research is not an option but a must. By incorporating proper statistical tools and using business analytics, you set yourself on the path to sustainable competitive advantage.
The question isn’t whether to use statistics in business research—it’s mandatory for competitive survival. The real question is: How quickly can you implement them? By implementing these applied statistics methods and leveraging business analytics, you position your organization for sustainable competitive advantage
Ready to Become Data-Driven? Let's Transform Your Business With Statswork.
Don’t let your competitors outpace you with superior insights. Statswork specializes in implementing applied statistics and business analytics solutions that transform raw data into strategic competitive advantage.
Schedule Your Free Business Analytics Strategy Consultation with Statswork Today →
Discover how leading organizations are partnering with Statswork to achieve:
- 30%+ improvement in decision quality
- Faster time-to-insight with statistical rigor
- Measurable competitive advantage through data-driven strategies
Contact Statswork’s business research specialists now and unlock your organization’s data potential. Your statistical advantage awaits.
Frequently Asked Questions (FAQs)
Business statistics are used to: (1) forecast market trends and future performance, (2) identify operational inefficiencies and solve complex problems, (3) make data-driven decisions backed by evidence rather than intuition, (4) assess financial performance and manage risk effectively, and (5) optimize resource allocation and improve organizational productivity.
Statistics provide reliability and validity to research findings by enabling researchers to analyze large datasets objectively, test hypotheses rigorously, identify patterns and relationships between variables, draw meaningful conclusions from data, and present evidence-based recommendations that stakeholders can trust.
Businesses use statistics to evaluate market competition, analyze customer behavior, forecast sales and revenue, monitor quality assurance, assess employee performance, manage financial portfolios, conduct audits and compliance checks, and optimize supply chain operations—all to gain competitive advantage through data-driven decision-making.
The five most common statistical tools are: (1) regression analysis (measuring relationships between variables), (2) hypothesis testing (validating assumptions), (3) descriptive statistics (summarizing data patterns), (4) correlation analysis (identifying variable associations), and (5) statistical sampling (drawing valid conclusions from subsets of data)..
The best statistical tool depends on your research objective: regression analysis excels at predicting outcomes and identifying variable relationships, hypothesis testing validates business assumptions, descriptive statistics summarizes business performance, and statistical sampling provides cost-effective auditing and compliance verifications based on your specific business need.
References:
- Giriraj Kiradoo, Associate Professor, Department of Management & Technology, Govt. Engineering College Bikaner, Rajasthan, India https://www.researchgate.net/public
- Vasuki, M., Mishra, A. K., Kumar, A. D., Celestin, M., Perarasan, K., Vinayakan, K., … & PS, A. (2026). The Use of Statistical Sampling in Auditing Business Contracts for Legal and Regulatory Compliance. Poornaprajna International Journal of Management, Education & Social Science (PIJMESS), 3(2), 92-135. https://www.poornaprajnapublication
- Hacherl, A., & Elgin, I. L. Teaching Multicollinearity in Business Statistics: An Applied Approach Using Real-World Regression Models. Business Education Innovation Journal VOLUME 17 NUMBER 2 December 2025, 212. http://www.beijournal.com/images
- Younis, H., Salem, H. M., Alsanea, M. S., Elemam, H. Z., & Abaker, A. O. (2025). Analysis of the factors affecting the financial performance of insurance companies using statistical modeling. Journal of Applied Science, Engineering, Technology, and Education, 7(1), 171-180. https://journal.mattawangmediatama