

Analysis and prediction of income and economic hierarchy on census data using data analytics And Data Analysis – Statswork
The greatest trouble in the machine-learning field is the availability of clean and high quality datasets. Demographic data constitutes a major role in the economic growth of the nation. It helps in finding the income growth of the people, how much are from urban and rural areas and how educated every person in the nation. In this blog, I will discuss how Data Analytics can be helpful in predicting the income and economic hierarchy on Census Data Analytics.
Sharath et al (2016) discussed the data analytics method to predict the same on the census data obtained from Kaggle. The dataset involve 3.5 million U.S. households consists of their education, work, transportation they use, usage of internet, etc. Here, I will point out the usage of data analytics for census data as discussed in Sharath et al (2016).
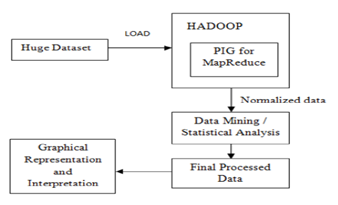
Before analysing the data, the main pre-requisite is that the data must be normalized for performing Statistical Analysis. Hadoop is used as a first stage for the large dataset and PIG MapReduce is adopted for the normalisation of the dataset. Later, the statistical analysis is performed and the results are interpreted. The following figure explains clearly the steps involved in this process.
The importance of the normalization before proceeding with the Statistical data analysis is clearly explained in the following figure.
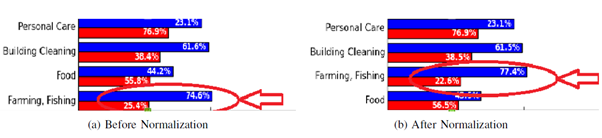
From the above figure, it is noted that the percentage of men in farming and fishing industry is found to be increased for 3.8% after normalization and the percentage of women in that field is also gets increased. This clearly satisfies the need and importance of normalization of the census data. In this study, normalization is used to reduce the execution time and improves the efficiency of the results. Two normalization is done for this purpose but before that there exists few blank entries in the dataset and this can be handled to avoid invalid results. For the first level, the actual data is used without any modifications, whereas in the second level of normalization, the actual data is inputted and then modified with a suitable mathematical methods.

The main aim of this study is that depicting the following
- Gender distribution against occupation
- Relationship between education and salary
- Economic hierarchy and prediction of classes
- theoretical versus the actual values for Benford’s Law
- Mean and Median of Income using Heatmap
We will now look at the results and Data Interpretations from the analysis. Figure 1 depicts the first objective of the study i.e. obtaining the percentage of gender distribution against occupation.
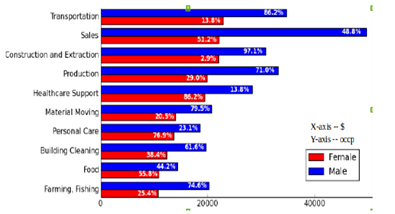
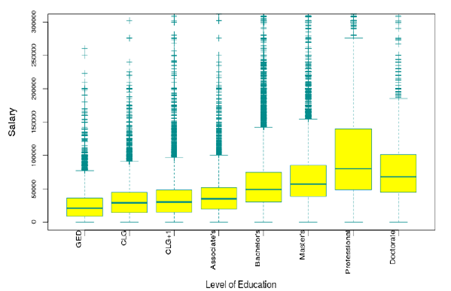
From the above graph, one can infer that which gender involved most in which occupation. Here, one can see that percentage of men in the dales field is more in number than compared to others. Transportation field also contains higher percentage of men next to the Sales. In addition, percentage of women is distributed almost equally in all the occupational fields. Further, in order to achieve the second objective, boxplot technique is used to identify the relationship between the education and salary. This helps in understanding the income growth under different levels of education. Usually, the more educated person will get higher salary. However, from this graph, Professional degree holders are getting more salary than the doctorate degree holders which is quite unusual. Likewise, one can compare the median and quartiles of each field in the boxplot for better understanding of the level of education and annual salary.
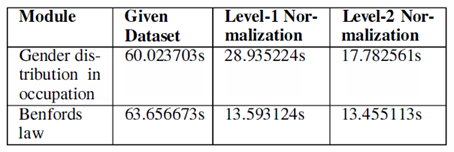
Analysis methods are the useful tool for analysing large dimensional dataset. However, K-means clustering is the most versatile technique for getting valid results. In that sense, in order to achieve the economic hierarchy, k-means clustering technique is adopted for economic income variable, and the distance between each data values and a set of clusters are measured using centroid clustering method and then plotted the cluster against the classes. Even though, the clustering technique is widely used in the literature, the problem of finding the number of clusters still persist. Furthermore, Benford’s law is discussed for plotting the actual versus the theoretical values. Finally, the mean and median of the income across the states is depicted using heat maps. For more information in this regard, refer Sharath et al (2016). In addition, the time complexity of the performance of the analysis gets decreased by including the level of normalization is also discussed and are tabulated below.
In conclusion, in the past decades, handling large datasets becomes a major problem in the Statistical Analysis because of the inferring invalid results. However, recently with the advent of computational strategies, researchers are involved in handling big data in easier way particularly using Hadoop and MapReduce techniques. In that sense, there are lot of scope for the Data Scientist to handle big data through machine learning and deep learning techniques. Practically, the development of the nation is analysed using the census data collected during the certain periods. This helps in understanding the growth of the population, wealth of the nation, and understanding the needs for the improvement for the welfare of the nation and people. In this study, the census data from U.S. Bureau is analysed to predict the economic growth and the Data Analytics techniques used here provides better insights towards it.
See also here
.- Sharath et al (2016). 2016 International Conference on Computational Systems and Information Systems for Sustainable Solutions. 249-254.
- Benfords Law : https://en.wikipedia.org/wiki/Benford%27s_law
- K-mean Clustering : https://en.wikipedia.org/wiki/K-means_clustering
 Previous Post
 Next Post