
Application of Logistic Regression using R Programming
October 23, 2019
APPLICATION OF TIME SERIES ANALYSIS IN FINANCIAL ECONOMICS
November 1, 2019Chi-square statistics in research for data analysis
Meta Analysis Service
- What Is the Chi-Square Test Testing For?
- Chi-Square Test and Marketing Research
- The Formula and Hypothesis Logic
- An Example Chi Square Test
- Related Tests Worth Knowing
- Chi-Square Test vs T-Test
- Data Types That Work with Chi-Square
- Running the Test: Software Options
- Areas of Application for the Chi-Square Test
- Conclusion
Recommended Reads
Contact us
Brief Description:
The Chi-Square Test is a statistical tool that is commonly employed to assess the relationship between two or more variables. This blog describes the objective, formula, hypothesis, applications, statistical tools, and limitations of the chi-square test, as well as comparing it with other statistical methods, like the t-test and the Fisher’s exact test. The blog further emphasizes how professional statistics consultation can help organizations choose the correct test and make evidence-based decisions out of their research.
Data analysis in categories is currently an essential component in making decisions in both business and academic fields – data such as surveys, product preferences, treatment effects, and market segmentation do not usually present themselves in the form of means [1]. Categorical data analysis is, therefore, something that the chi-square test can perform better than many other statistical analyses used for these data types.
What Is the Chi-Square Test Testing For?
The chi-square test of independence is a non-parametric test. This implies that the test can analyze data without considering the assumptions about its distribution (such as normally distributed data) and comparison of means as done in a t-test. The test uses the contingency table to establish if there is a real relationship between two factors or if the results are purely random.
Chi-Square Test and Marketing Research
Marketing researchers and people running A/B tests have always needed a test to help them check if the results from their study are significantly different between different groups. These groups may be defined by region, channel, campaign, etc.
The Formula and Hypothesis Logic
Each Chi-Square Test begins with a set of null and alternative hypotheses. The first one states that there is no dependence between variables, while the second hypothesis suggests that there is a relationship between these two.
The Chi Square formula calculates, for each cell in the table, the ratio of the squared difference between observed and expected frequency to the expected frequency and sums up all those ratios across the whole table [2]. Then, it compares this sum to the critical value obtained from the Chi Square distribution table, using degrees of freedom (number of rows – 1 x number of columns – 1) and the significance level equal to 0.05.
An Example Chi Square Test
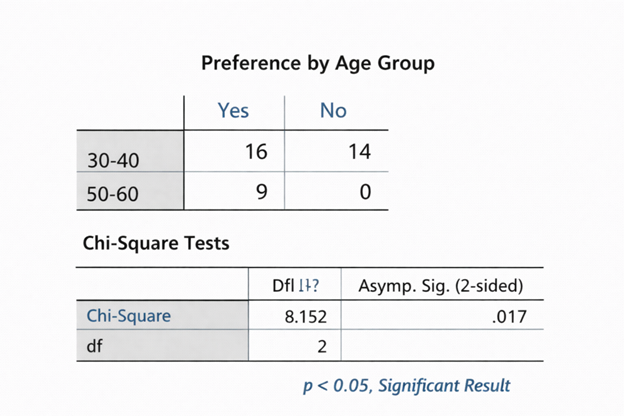
Consider a retail brand survey of 112 customers about product preferences across two regions. Comparing the observed purchase counts against the expected counts — assuming region has no real effect — produces a chi-square value that comfortably clears the critical threshold, leading to rejection of independence. In practical terms, regional preference is real, and that single finding can reshape a customer segmentation or campaign targeting strategy [3].
Related Tests Worth Knowing
The chi-square family extends well beyond the basic independence test:
| Test | Conditions for its Use |
| Chi-square goodness of fit test | For testing if one variable conforms to a particular distribution |
| Chi-square test of homogeneity | To make comparisons of distributions among several populations or markets |
| Fisher’s exact test | If sample sizes are small or cells in tables are sparse |
| McNemar’s test | For analyzing pairs of categorical variables, e.g., before/after a marketing campaign |
| Cramér’s V/effect size | To determine the strength of a proven association |
Chi-Square Test vs T-Test
Commonly, there is some confusion with respect to chi-square tests and t-tests. T-tests measure means differences in continuous variables between two groups; chi-square measures frequency of categorical outcomes. Using a wrong test means that any subsequent data analysis will be flawed even if the data is flawless.
Data Types That Work with Chi-Square
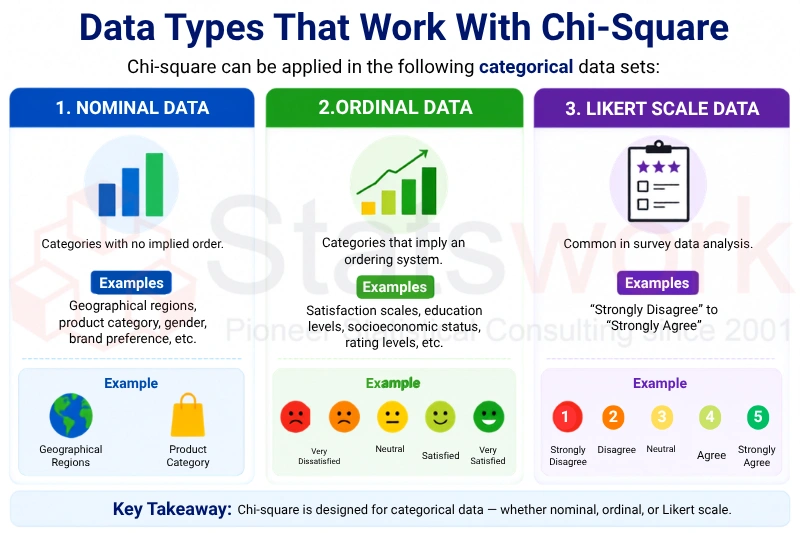
Chi-square can be applied in the following categorical data sets:
- Nominal Data — Categories with no implied order, for example, geographical regions, product category, etc.
- Ordinal Data — Categories that imply an ordering system, for example, satisfaction scales, etc.
- Likert Scale Data – Common in survey data analysis, for example, “Strongly Disagree” to “Strongly Agree”
Running the Test: Software Options
| Platform | Application |
| Chi-square test in SPSS | Crosstabs command – popular in surveys and clinical studies |
| Chi-square test in Excel | CHISQ.TEST function or a chi-square calculator |
| Chi-square test in R / Python | chisq.test() in R; scipy.stats.chi2_contingency in Python |
| SAS | Prevalent in compliance-based environments processing clinical trials data |
Areas of Application for the Chi-Square Test
- Marketing & Growth departments – verifying conclusions from A/B testing and segmenting customers
- Pharmaceutical/Clinical Studies – comparing groups within clinical trials
- UX & Product Departments – checking whether changes in the design affected categorical conversion behavior
- Research & Policy Organizations – proving patterns found through survey research [4]
Restrictions to Note
- The chi-square test is not reliable when expected frequency in any cell is less than 5; then Fisher’s exact test is recommended
- Lower sample size leads to lower statistical power, making it harder to find relationships
- Association but not causality is proven by the test and requires further interpretation without Cramér’s V
- All findings must be accompanied by their significance level and p value
Conclusion
Chi-square analysis is one of the most reliable tests for working with categorical data and providing significant information in marketing, healthcare, medical trials, education, and business decisions [4]. However, choosing the correct chi-square test, meeting assumptions of the chosen test, and interpretation of results are essential factors to get valid findings.
It is at this point where Statswork can become your partner in the process of using statistics for analyzing data. Statisticians working with us will be able to select an appropriate test for you, meet assumptions of the test, carry out the analysis, and interpret the results. For organizations not having biostatisticians and statisticians, consulting from Statswork will bring reliable findings to your work.
Frequently asked question:
The chi-square test is used to analyze categorical data by comparing observed and expected frequencies to determine whether there is a statistically significant association between variables or whether the differences occurred by chance.
The purpose of the chi-square test is to determine whether a significant relationship exists between categorical variables or whether observed differences in frequencies are due to random variation.
The six steps of a chi-square test involve stating the hypotheses, organizing the data into a contingency table, calculating expected frequencies, computing the chi-square statistic, determining the p-value or critical value using the degrees of freedom, and interpreting the results to accept or reject the null hypothesis.
You should use ANOVA when comparing the means of a continuous variable across multiple groups, whereas the chi-square test is appropriate for examining relationships or differences between categorical variables.
The chi-square test should be used when analyzing categorical data and frequencies, while the t-test is used to compare the means of a continuous variable between two groups.
No, ANOVA is not outdated; it remains a widely used and reliable statistical method for comparing group means and is extensively applied in research, business, healthcare, and scientific studies.
Reference:
- Dizaji, P. A., Heidary, F., & Gharebaghi, R. (2025). Chi-square test applications. Medical hypothesis, discovery & innovation in optometry, 6(4), 150-159.https://www.mehdijournal.com/index.php/mehdioptometry/article/view/1287
- Basta, M. N., & Neves, R. I. (2026). Categorical variable analyses: Chi-square, Fisher exact, and Mantel-Haenszel tests. Translational Plastic Surgery, 143-147. https://www.sciencedirect.com/science/chapter/edited-volume/abs/pii/B978032391168900034X
- Abimanyu, G. R., & Purbolaksono, M. D. (2025, July). Sentiment Analysis on Game Review on the Steam Platform using Support Vector Machine, TF-IDF and Chi-Square Methods. In 2025 International Conference on Data Science and Its Applications (ICoDSA)(pp. 1190-1195). IEEE.https://ieeexplore.ieee.org/abstract/document/11157432
- Grillo, R., Barretto, M. D. A., Brozoski, M. A., Melhem-Elias, F., & Deboni, M. C. Z. (2025). Strategies to boost citations in maxillofacial surgery literature: A meta-data science analysis. Journal of Cranio-Maxillofacial Surgery, 53(8), 1149-1155. https://www.sciencedirect.com/science/article/abs/pii/S1010518225001350
Contact us

Related posts