
- Services
- Data Analysis services
- Sample Work
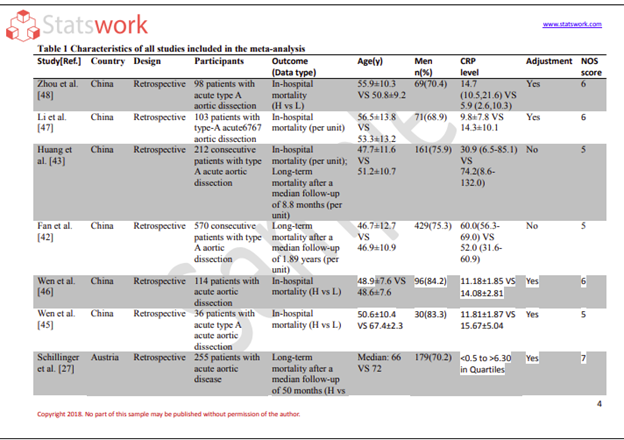
Data Analysis services
- Secondary Qualitative Research Services
- Secondary Quantitative Research Services
- Meta-Analysis Research services
- Sample Work
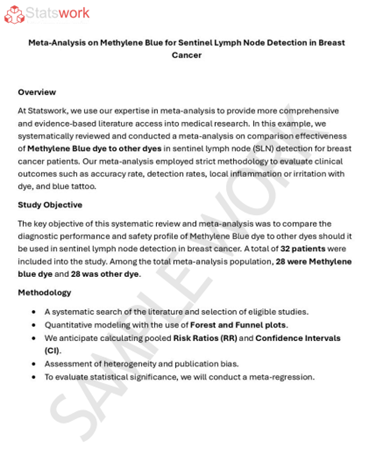
Meta-Analysis Research Services
- Data Collection Services
- Sample Work
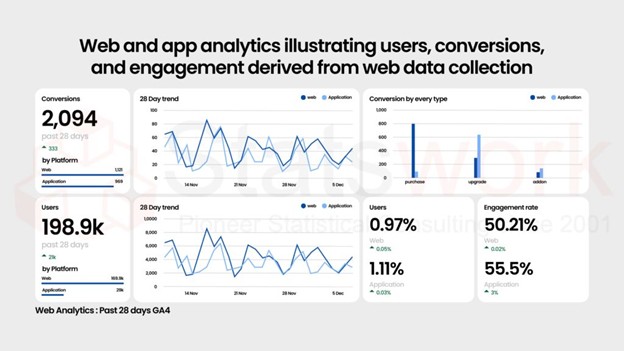
Data Collection Services
- Statistical & Biostatistics services
- Sample Work
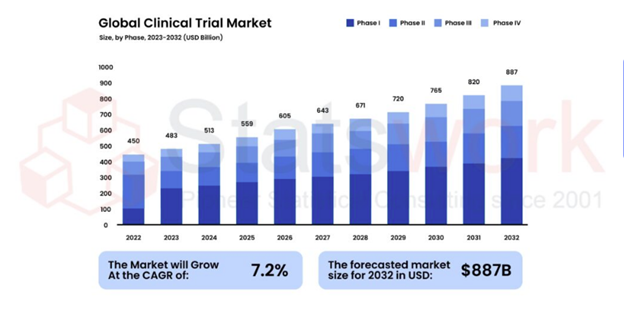
Statistical Programming & Biostatistics services
- Data Management Services
- Sample Work
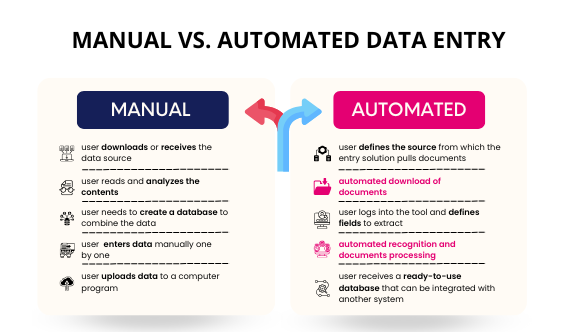
Data Management Services
- Research methodology services
- Sample Work
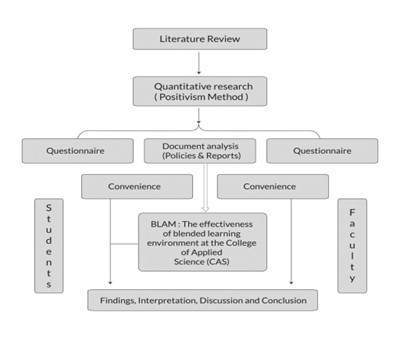
Research methodology services
- Tool Development Services
- Sample Work
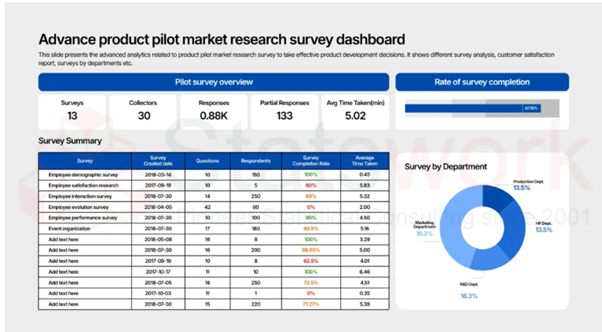
Tool development services
- Statistical Interpretation services
-
Statistical Interpretation services
- Sample Work
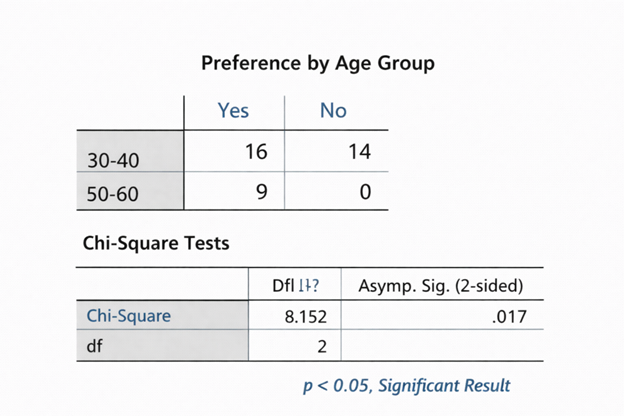
Statistical Interpretation services
-
- Sample Size Calculation Services
-
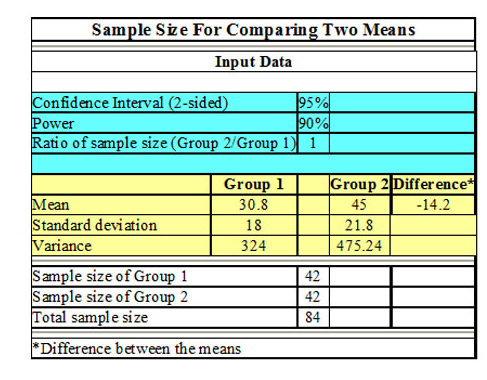
Sample Size Calculation Services
- Sample Work
Sample Size Calculation Services
-
- AI & ML Services
-
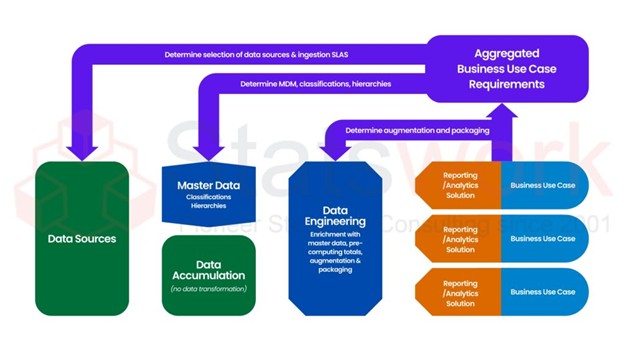
Artificial Intelligence and Machine Learning Services
- Sample Work
Artificial Intelligence and Machine Learning Services
-
- Meaningful Visualization Services
- Thought Leadership Services
- Report Generation Services
-
Report generation Service
- Sample Work

Report generation Services
-
- Data Analysis services
- Industries
- About Us
- Blog
- Insights
- Contact Us
- Services
- Data Analysis services
- Sample Work
Data Analysis services
- Secondary Qualitative Research Services
- Secondary Quantitative Research Services
- Meta-Analysis Research services
- Sample Work
Meta-Analysis Research Services
- Data Collection Services
- Sample Work
Data Collection Services
- Statistical & Biostatistics services
- Sample Work
Statistical Programming & Biostatistics services
- Data Management Services
- Sample Work
Data Management Services
- Research methodology services
- Sample Work
Research methodology services
- Tool Development Services
- Sample Work
Tool development services
- Statistical Interpretation services
-
Statistical Interpretation services
- Sample Work
Statistical Interpretation services
-
- Sample Size Calculation Services
-
Sample Size Calculation Services
- Sample Work
Sample Size Calculation Services
-
- AI & ML Services
-
Artificial Intelligence and Machine Learning Services
- Sample Work
Artificial Intelligence and Machine Learning Services
-
- Meaningful Visualization Services
- Thought Leadership Services
- Report Generation Services
-
Report generation Service
- Sample Work
Report generation Services
-
- Data Analysis services
- Industries
- About Us
- Blog
- Insights
- Contact Us
Clinical Trial Design and Analysis: A Complete Guide for Pharma Teams
Qualitative Research Service
- What Is Clinical Trial Design and Analysis?
- Key Decisions in Clinical Trial Design
- Choosing the Right Clinical Trial Design
- Sample Size Calculation and Statistical Power
- Defining the Estimand (ICH E9(R1))
- Developing a Statistical Analysis Plan (SAP)
- Clinical Trial Data Management and Quality
- Statistical Programming and CDISC Deliverables
- Clinical Trial Statistical Analysis
- Regulatory and GCP Considerations
- Common Challenges and How to Prevent Them
- How Statswork Supports Pharma Clinical Trials
Recommended Reads
Contact us
Clinical trial design and analysis is the process of planning how a study will answer a clinical question and then using prespecified statistical methods to turn the collected data into reliable evidence on safety and efficacy [1]. For pharma teams, getting it right means choosing the right design, defining the estimand and endpoints, calculating an adequate sample size and locking the statistical analysis plan (SAP) before anyone sees unblinded results.
KEY TAKEAWAYS
- Define the estimand first — it drives the endpoints, design, sample size and missing-data strategy [2].
- Match the design (parallel, crossover, factorial, group-sequential, adaptive) to the disease, intervention and decision you need to make.
- Base the sample size on clinically justified assumptions and inflate for expected dropout.
- Finalize the SAP before database lock, including multiplicity, interim analyses and sensitivity analyses.
Deliver CDISC-conformant SDTM/ADaM datasets and validated TLFs for regulatory submission [3].
What Is Clinical Trial Design and Analysis?
Clinical trial design is the framework that defines how a study will be conducted to answer a specific research question. It sets the study population, treatment groups, endpoints, follow-up period, and methods such as randomization and blinding. A sound design minimizes bias and makes the result interpretable [4].
Clinical trial analysis is the statistical evaluation of the data collected. It estimates the size of the treatment effect, quantifies its uncertainty and tests prespecified hypotheses. Analyses typically cover baseline characteristics, efficacy, safety, subgroups and sensitivity to assumptions, as defined in the protocol and SAP [5].
Design and analysis are inseparable: decisions made at the design stage — the estimand, the endpoint, the randomization scheme — determine which analyses are valid at the end.
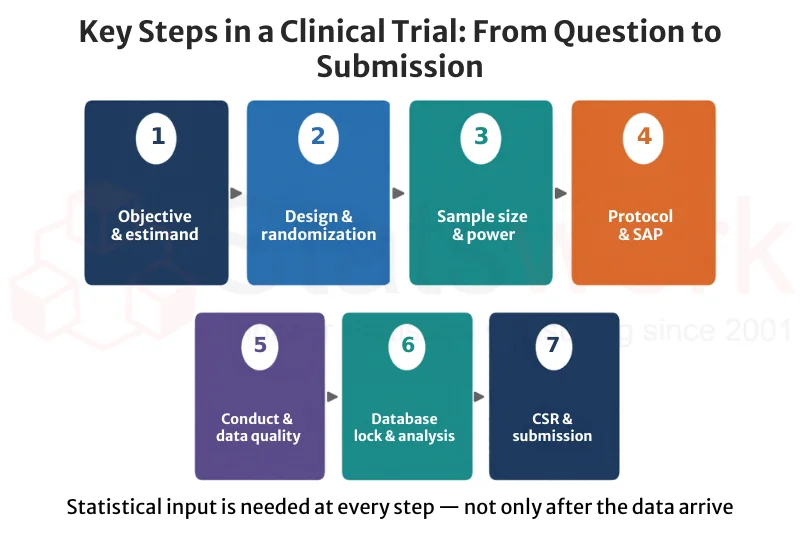
Figure 1. The seven key steps of a clinical trial and where biostatistics contributes.
Key Decisions in Clinical Trial Design
A protocol translates the research objective into a structured plan. These decisions must be made before enrollment because they affect validity, sample size and the statistical methods that can be used.
Objectives, Hypotheses and Trial Framework
The objective states what the trial must establish; the statistical hypothesis formalizes it. A critical early choice is the comparison framework, because it changes the hypothesis, the margin and the sample size [6]:
Framework | Question answered | Typical use |
Superiority | Is the new treatment better than control? | Placebo-controlled or add-on trials |
Non-inferiority | Is it not unacceptably worse than an active control (within a prespecified margin)? | New treatment with safety, cost or convenience advantages |
Equivalence | Is the difference within a prespecified margin in both directions? | Biosimilars, bioequivalence studies |
Study Population and Eligibility Criteria
Inclusion criteria define who is needed to answer the question; exclusion criteria remove participants for whom safety, response or interpretation would be compromised. Criteria that are too narrow limit generalizability and slow recruitment, so they should be justified against the target population [4].
Endpoints and Outcome Measures
The primary endpoint addresses the main objective and drives the sample size; secondary endpoints provide supporting evidence. Endpoints should be clinically meaningful, measurable and precisely defined — including timing, assessment method and how events such as treatment discontinuation are handled.
Randomization, Blinding and Control Groups
Randomization balances known and unknown prognostic factors. Block randomization keeps group sizes balanced over time, and stratified randomization balances important factors such as site or disease severity. Blinding (single, double or assessor-blind) limits performance and assessment bias. The control — placebo, active comparator or standard of care — must be chosen to answer the question credibly [6].
Trial Phases at a Glance
Phase | Primary goal | Typical size | Key statistical focus |
I | Safety, tolerability, pharmacokinetics | 20–100 | Dose-escalation rules, PK modeling |
II | Preliminary efficacy and dose selection | 100–300 | Dose–response, go/no-go decisions |
III | Confirm efficacy and safety | Hundreds to thousands | Powered hypothesis tests, multiplicity control |
IV | Post-marketing safety and effectiveness | Varies widely | Observational methods, rare-event detection |
Sizes are indicative ranges only; the actual sample size always comes from a formal calculation.
Choosing the Right Clinical Trial Design
The right design depends on the objective, intervention, disease course, expected effect size and operational constraints. A well-chosen design improves statistical efficiency and reduces bias.
Design | Best suited for | Key consideration |
Parallel-group RCT | Most confirmatory comparisons; treatments with lasting effects | Each participant stays in one arm; simplest to analyze and interpret |
Crossover | Stable chronic conditions with reversible effects | Needs an adequate washout; period and carryover effects must be assessed |
Factorial | Testing two or more interventions in one trial | Efficient if no interaction; detecting interactions needs more power |
Group-sequential | Trials where early stopping for efficacy or futility is valuable | Interim boundaries must control the overall Type I error [7], [8] |
Adaptive | Uncertain effect size or dose; multiple arms | Adaptations must be prospectively planned with simulated operating characteristics [9] |
Adaptive designs allow prespecified changes — such as sample-size re-estimation, dropping arms or changing allocation ratios — based on accumulating data, while preserving trial integrity [10], [11]. Regulators expect the adaptation rules, timing and statistical methods to be fixed in advance and their operating characteristics to be evaluated, usually by simulation [9]. The ICH E20 draft guideline (2025) sets out harmonized principles for adaptive trials and is useful reading for any sponsor planning one [12].
Sample Size Calculation and Statistical Power
Sample size calculation determines how many participants are needed to answer the primary objective reliably. It depends on the primary endpoint, the minimum clinically important difference, variability or event rate, significance level (α), target power and expected attrition.
Statistical power is the probability of detecting the specified effect if it truly exists. Confirmatory trials commonly target 80% or 90% power. An underpowered trial risks missing a real benefit; an oversized one wastes budget and exposes more participants than necessary.
WORKED EXAMPLE: TWO-ARM SUPERIORITY TRIAL
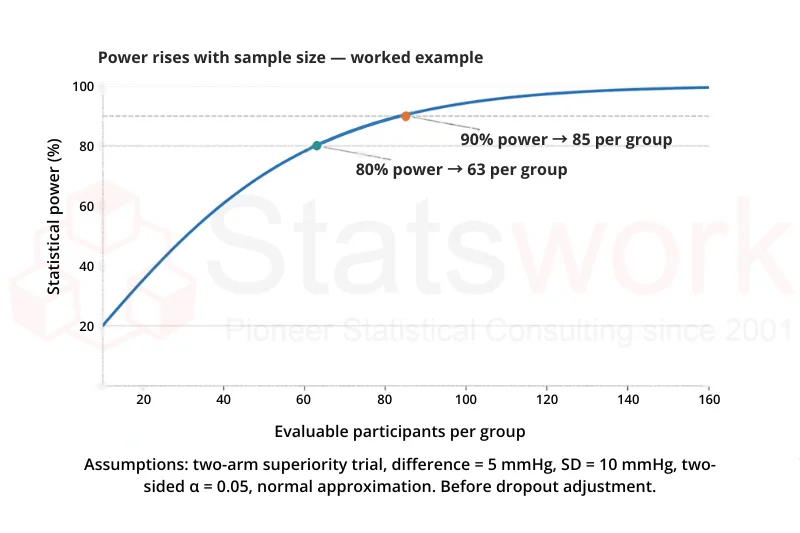
A sponsor expects a new antihypertensive to lower systolic blood pressure by 5 mmHg more than control, with a standard deviation of 10 mmHg, two-sided α = 0.05 and 90% power.
n per group = 2 × (z₀.₉₇₅ + z₀.₉₀)² × (σ / Δ)² = 2 × (1.960 + 1.282)² × (10 / 5)² ≈ 85 per group
Allowing for 15% dropout: 85 ÷ 0.85 = 100 per group (200 in total). At 80% power the requirement falls to 63 evaluable participants per group.
Defining the Estimand (ICH E9(R1))
An estimand is a precise description of the treatment effect a trial aims to estimate. ICH E9(R1) requires sponsors to define it up front, explicitly stating how intercurrent events — such as treatment discontinuation, rescue medication or death — are handled [2]. The estimand then aligns the design, data collection, primary analysis and sensitivity analyses.
The Five Estimand Attributes | |
Attribute | Example: type 2 diabetes trial |
Population | Adults with type 2 diabetes inadequately controlled on metformin |
Treatment | Investigational drug + metformin vs placebo + metformin |
Variable (endpoint) | Change in HbA1c from baseline to week 26 |
Intercurrent events | Use of rescue medication — handled with a treatment-policy strategy (outcome used regardless) |
Population-level summary | Difference in mean change in HbA1c between groups |
Developing a Statistical Analysis Plan (SAP)
The SAP turns the protocol’s objectives into prespecified statistical methods. It should be finalized before database lock — and before unblinding — so that analytical choices cannot be influenced by the results [1].
SAP Content Checklist | |
SAP section | What it should specify |
Estimands & hypotheses | Primary and key secondary estimands, null and alternative hypotheses |
Analysis populations | Full analysis set (ITT), per-protocol set, safety set — with definitions |
Statistical models | Primary model, covariates, stratification factors, effect measures |
Missing data | Primary assumption and handling; sensitivity analyses under alternative assumptions |
Multiplicity | Testing hierarchy or alpha-allocation strategy across endpoints, doses and time points |
Interim analyses | Timing, purpose, stopping boundaries, alpha spending, DMC role |
Subgroups & sensitivity | Prespecified subgroups, sensitivity and supplementary analyses |
Outputs | Shells for tables, listings and figures (TLFs) |
Interim Analyses and Data Monitoring Committees
Looking at accumulating data repeatedly inflates the false-positive rate unless it is controlled. Group-sequential boundaries such as O’Brien–Fleming are conservative early and preserve most of the alpha for the final analysis [7]; the Lan–DeMets alpha-spending approach allows flexible timing of interim looks [8]. Unblinded interim results should be reviewed by an independent data monitoring committee (DMC) so that the sponsor’s study team remains blinded.
Clinical Trial Data Management and Quality
Reliable analysis depends on accurate, complete and traceable data. Data management covers how study data are collected, validated, cleaned, coded and maintained throughout the trial.
Data Cleaning and Validation
Prespecified edit checks identify missing values, inconsistencies, out-of-range values, duplicates and cross-form discrepancies. Queries are resolved under documented procedures, with every change captured in an audit trail.
Missing Data and Protocol Deviations
The best strategy is prevention: designs and procedures that keep participants in follow-up — even after they stop treatment — reduce missing data at the source [13]. For the data that remain missing, the primary method should match the estimand and its assumptions. Common approaches include mixed models for repeated measures (MMRM) and multiple imputation, with sensitivity analyses such as tipping-point or reference-based imputation to test how robust the conclusion is [14]. Important protocol deviations should be classified before unblinding according to their potential impact on the results.
Database Lock and Analysis Readiness
Before lock, all queries, coding, reconciliation (for example, serious adverse events against the safety database) and quality checks must be complete. The locked database is the controlled dataset for the final analysis.
Statistical Programming and CDISC Deliverables
Regulators review data as well as reports. The FDA requires study data in CDISC standards for most new drug and biologic submissions, and Japan’s PMDA has similar requirements [3]. Statistical programming — typically in SAS or R — turns raw data into these submission-ready deliverables [15]:
Deliverable | What it is | Why it matters |
SDTM | Standardized tabulation of collected data | Required format for regulatory data review |
ADaM | Analysis-ready datasets traceable to SDTM | Lets reviewers reproduce every analysis |
Define-XML | Machine-readable metadata for each dataset | Documents variables, derivations and code lists |
TLFs | Tables, listings and figures from the SAP | Core content of the clinical study report (CSR) |
Independent QC | Double programming and output comparison | Catches errors before results are reported |
Clinical Trial Statistical Analysis
The analysis evaluates whether the evidence supports the study objectives and estimates the treatment effect with its uncertainty. Methods must suit the endpoint, design and analysis population.
Analysis Populations
The full analysis set, based on the intention-to-treat (ITT) principle, includes all randomized participants as randomized and is usually primary for superiority trials. The per-protocol set excludes participants with major deviations and is an important supportive analysis — especially in non-inferiority trials, where ITT alone can bias towards similarity [1]. The safety set includes everyone who received study treatment.
Efficacy Analysis by Endpoint Type
Endpoint type | Example | Common primary methods | Effect measure |
Continuous | Change in HbA1c | ANCOVA; MMRM for repeated measures | Mean difference (95% CI) |
Binary | Responder rate | Logistic regression; CMH test | Odds ratio or risk difference |
Time-to-event | Progression-free survival | Kaplan–Meier; log-rank test; Cox model | Hazard ratio |
Count | Exacerbations per year | Negative binomial regression | Rate ratio |
Results should always report the estimated effect with a confidence interval, not just a p-value: a statistically significant result is not necessarily clinically meaningful.
Safety Analysis
Safety analysis summarizes adverse events, serious adverse events, laboratory values and vital signs by treatment group, coded with MedDRA. Exposure-adjusted incidence rates are useful when treatment durations differ between groups.
Sensitivity, Subgroup and Multiplicity Considerations
Sensitivity analyses test whether conclusions hold under alternative assumptions, particularly about missing data [2]. Subgroup analyses should be prespecified and interpreted cautiously, as trials are rarely powered for them. When several endpoints, doses or time points support confirmatory claims, a prespecified multiplicity strategy — such as hierarchical (fixed-sequence) testing, Holm, or graphical approaches — is needed to control the familywise error rate [16].
Regulatory and GCP Considerations
Trials must follow applicable regulations and Good Clinical Practice. The key ICH guidelines for statistical work are:
Guideline | Focus |
ICH E6(R3) (2025) | Good Clinical Practice — quality by design, critical-to-quality factors, risk-proportionate oversight [17] |
ICH E8(R1) (2021) | General considerations for clinical studies and designing quality into trials [4] |
ICH E9 (1998) | Statistical principles for clinical trials [1] |
ICH E9(R1) (2019) | Estimands and sensitivity analysis [2] |
ICH E10 (2000) | Choice of control group, including non-inferiority trials [6] |
ICH E20 (draft, 2025) | Adaptive designs for clinical trials [12] |
For publication, results of randomized trials should be reported according to the CONSORT 2025 statement [18]. For multinational programs, sponsors should also check region-specific requirements from agencies such as the FDA, EMA and PMDA. Any change that could affect trial integrity must be assessed, documented and justified.
Common Challenges and How to Prevent Them
Challenge | Risk | Prevention |
Vague objectives | Endpoints and analysis don’t answer the question | Define the estimand before finalizing the protocol |
Optimistic sample size assumptions | Underpowered trial; inconclusive result | Use prior data, run sensitivity scenarios, consider sample-size re-estimation |
Missing data | Biased estimates; reduced power | Retain participants after discontinuation; prespecify MMRM/MI and sensitivity analyses |
Protocol deviations | Compromised efficacy or safety interpretation | Classify deviations before unblinding; train sites |
Multiplicity | Inflated false-positive rate | Prespecify a testing hierarchy or alpha-allocation strategy |
Post hoc analysis changes | Bias and loss of regulatory credibility | Finalize the SAP before unblinding; document all changes |
Non-standard data | Submission delays; reviewer queries | Build CDISC SDTM/ADaM from study start |
How Statswork Supports Pharma Clinical Trials
Early statistical input prevents costly design flaws and keeps the protocol, data collection and analysis aligned across the trial lifecycle. Statswork supports sponsors and CROs at each stage:
Trial stage | Statswork biostatistics support |
Planning | Design selection, estimand definition, sample size and power (including simulation), randomization schedules |
Protocol & SAP | Statistical sections of the protocol, SAP authoring, TLF shells, DMC charters |
Conduct | Data review, interim analyses, blinded sample-size re-estimation support |
Analysis & programming | SDTM/ADaM datasets, Define-XML, TLFs in SAS or R with independent QC |
Reporting | Statistical input to the CSR, regulatory responses and publications |
Frequently Asked Questions
What is the role of an independent statistician in a clinical trial?
An independent statistician works separately from the sponsor’s study team, typically supporting the data monitoring committee. They prepare unblinded interim analyses so the DMC can review safety and efficacy, while the sponsor and investigators remain blinded. This separation protects trial integrity and reduces the risk that knowledge of interim results influences how the trial is run or analyzed.
What is an interim analysis in a clinical trial?
An interim analysis is a planned look at accumulating data before the trial ends. It can support stopping early for clear efficacy, futility or safety concerns, or trigger prespecified adaptations. Because repeated looks inflate the false-positive rate, the timing, decision rules and alpha-spending method must be defined in advance, usually in the protocol and SAP.
What is an estimand in clinical trials?
An estimand is a precise definition of the treatment effect a trial aims to measure. Under ICH E9(R1) it has five attributes: the population, treatment, variable (endpoint), handling of intercurrent events such as rescue medication or discontinuation, and the population-level summary, such as a difference in means. Defining it early aligns design, data collection and analysis.
What is multiplicity in clinical trial analysis?
Multiplicity arises when a trial tests several hypotheses — multiple endpoints, doses, time points or subgroups. Each extra test increases the chance of a false-positive finding. Confirmatory trials control this with a prespecified strategy, such as fixed-sequence (hierarchical) testing, Holm or Hochberg procedures, or graphical approaches that allocate and recycle alpha across hypotheses.
What is the difference between ITT and per-protocol analysis?
Intention-to-treat (ITT) analysis includes all randomized participants in the groups they were assigned to, preserving the benefits of randomization; it is usually the primary analysis in superiority trials. Per-protocol analysis includes only participants who followed the protocol closely. It is supportive in most trials but especially important in non-inferiority trials.
How does clinical trial statistical analysis support regulatory submission?
Regulators expect prespecified methods, reproducible results and full traceability. A finalized SAP, CDISC-conformant SDTM and ADaM datasets, Define-XML, validated TLFs, effect estimates with confidence intervals and documented sensitivity analyses allow reviewers to verify every result — reducing queries and supporting a smoother review.
Reference:
[1] International Council for Harmonisation. (1998). E9: Statistical principles for clinical trials. ICH. https://www.ich.org/page/efficacy-guidelines
[2] International Council for Harmonisation. (2019). E9(R1): Addendum on estimands and sensitivity analysis in clinical trials to the guideline on statistical principles for clinical trials. ICH. https://www.ich.org/page/efficacy-guidelines
[3] U.S. Food and Drug Administration. (n.d.). Study data standards resources. FDA. https://www.fda.gov/industry/fda-data-standards-advisory-board/study-data-standards-resources
[4] International Council for Harmonisation. (2021). E8(R1): General considerations for clinical studies. ICH. https://www.ich.org/page/efficacy-guidelines
[5] Lewis, J. A. (1999). Statistical principles for clinical trials (ICH E9): An introductory note on an international guideline. Statistics in Medicine, 18(15), 1903–1942. https://doi.org/10.1002/(SICI)1097-0258(19990815)18:15<1903::AID-SIM188>3.0.CO;2-F
[6] International Council for Harmonisation. (2000). E10: Choice of control group and related issues in clinical trials. ICH. https://www.ich.org/page/efficacy-guidelines
[7] O’Brien, P. C., & Fleming, T. R. (1979). A multiple testing procedure for clinical trials. Biometrics, 35(3), 549–556. https://doi.org/10.2307/2530245
[8] Lan, K. K. G., & DeMets, D. L. (1983). Discrete sequential boundaries for clinical trials. Biometrika, 70(3), 659–663. https://doi.org/10.1093/biomet/70.3.659
[9] U.S. Food and Drug Administration. (2019). Adaptive design clinical trials for drugs and biologics: Guidance for industry. FDA. https://www.fda.gov/regulatory-information/search-fda-guidance-documents/adaptive-design-clinical-trials-drugs-and-biologics-guidance-industry
[10] Pallmann, P., Bedding, A. W., Choodari-Oskooei, B., et al. (2018). Adaptive designs in clinical trials: Why use them, and how to run and report them. BMC Medicine, 16, 29. https://doi.org/10.1186/s12916-018-1017-7
[11] Bretz, F., Koenig, F., Brannath, W., Glimm, E., & Posch, M. (2009). Adaptive designs for confirmatory clinical trials. Statistics in Medicine, 28(8), 1181–1217. https://doi.org/10.1002/sim.3538
[12] International Council for Harmonisation. (2025). E20: Adaptive designs for clinical trials (Draft guideline, Step 2). ICH. https://www.ema.europa.eu/system/files/documents/scientific-guideline/ich-e20-guideline-adaptive-designs-clinical-trials_step-2b_en.pdf
[13] Little, R. J., Cohen, M. L., Dickersin, K., et al. (2012). The design and conduct of clinical trials to limit missing data. Statistics in Medicine, 31(28), 3433–3443. https://doi.org/10.1002/sim.5519
[14] Little, R. J., D’Agostino, R., Cohen, M. L., et al. (2012). The prevention and treatment of missing data in clinical trials. New England Journal of Medicine, 367(14), 1355–1360. https://doi.org/10.1056/NEJMsr1203730
[15] Clinical Data Interchange Standards Consortium. (n.d.). CDISC foundational standards (SDTM, ADaM, Define-XML). CDISC. https://www.cdisc.org/standards
[16] U.S. Food and Drug Administration. (2022). Multiple endpoints in clinical trials: Guidance for industry. FDA. https://www.fda.gov/regulatory-information/search-fda-guidance-documents/multiple-endpoints-clinical-trials
[17] International Council for Harmonisation. (2025). E6(R3): Guideline for good clinical practice. ICH. https://www.ich.org/page/efficacy-guidelines
[18] Hopewell, S., Chan, A.-W., Collins, G. S., et al. (2025). CONSORT 2025 statement: Updated guideline for reporting randomised trials. BMJ, 389, e081123. https://doi.org/10.1136/bmj-2024-081123