
- Services
- Data Analysis services
- Sample Work
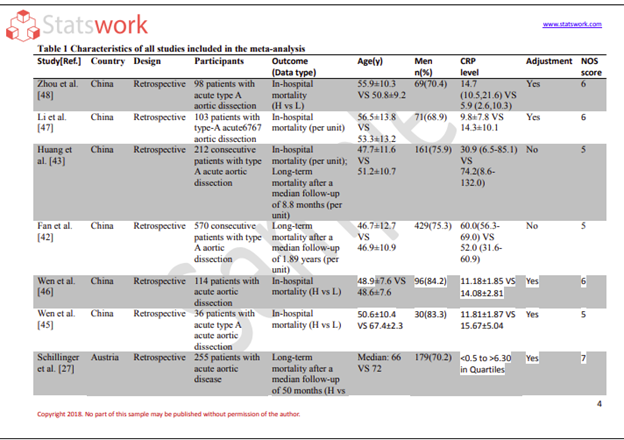
Data Analysis services
- Secondary Qualitative Research Services
- Secondary Quantitative Research Services
- Meta-Analysis Research services
- Sample Work
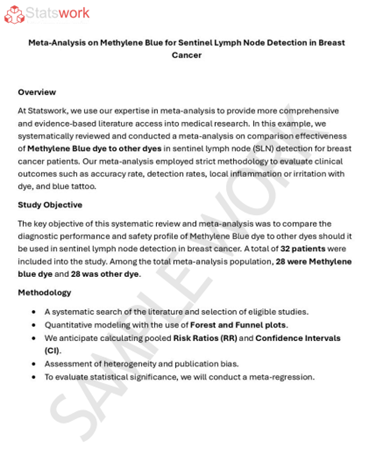
Meta-Analysis Research Services
- Data Collection Services
- Sample Work
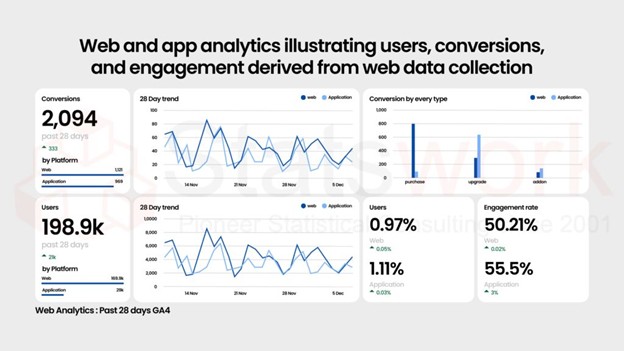
Data Collection Services
- Statistical & Biostatistics services
- Sample Work
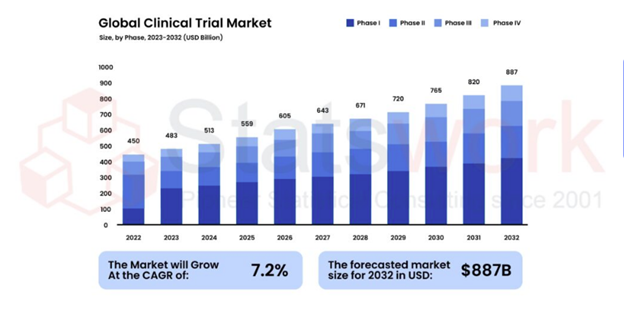
Statistical Programming & Biostatistics services
- Data Management Services
- Sample Work
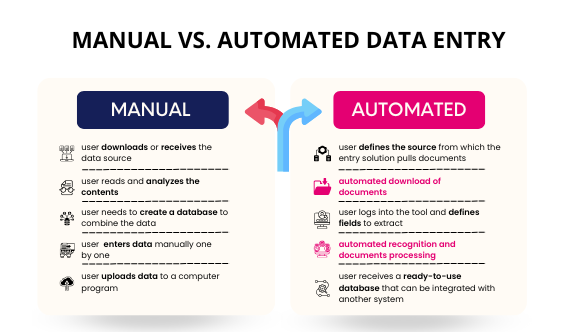
Data Management Services
- Research methodology services
- Sample Work
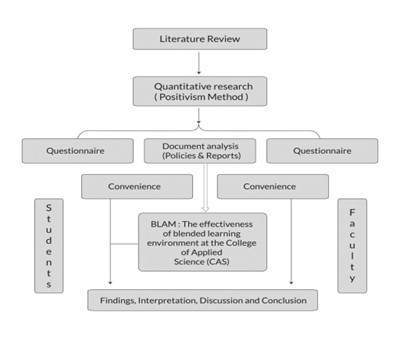
Research methodology services
- Tool Development Services
- Sample Work
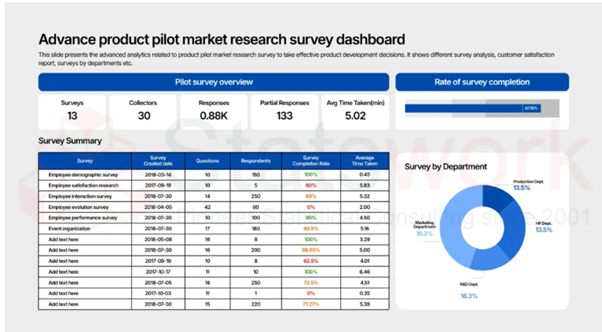
Tool development services
- Statistical Interpretation services
-
Statistical Interpretation services
- Sample Work
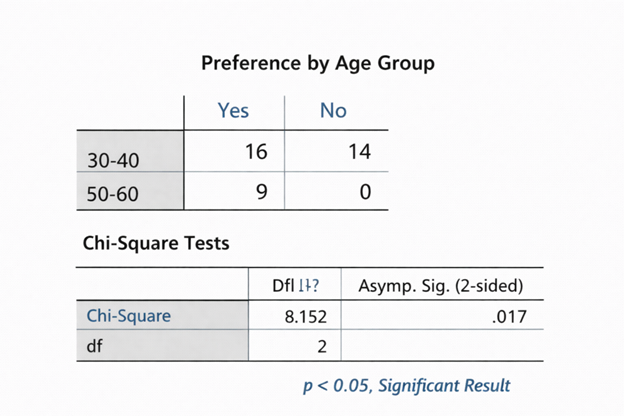
Statistical Interpretation services
-
- Sample Size Calculation Services
-
Sample Size Calculation Services
- Sample Work
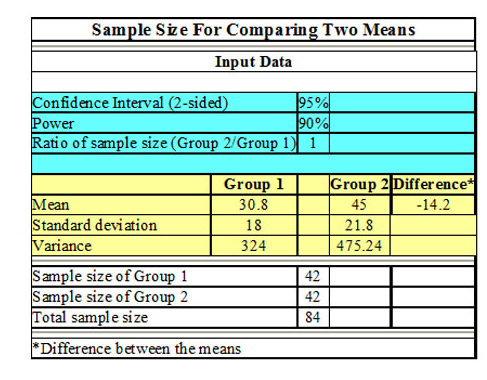
Sample Size Calculation Services
-
- AI & ML Services
-
Artificial Intelligence and Machine Learning Services
- Sample Work
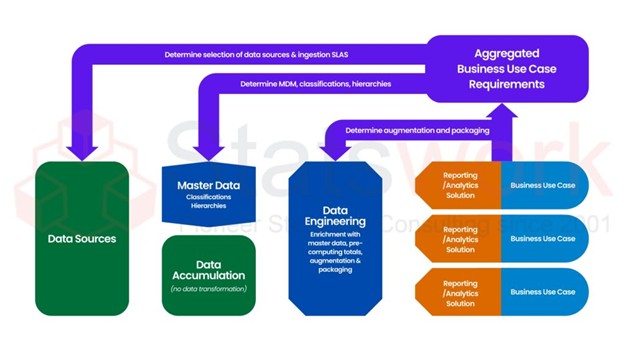
Artificial Intelligence and Machine Learning Services
-
- Meaningful Visualization Services
- Thought Leadership Services
- Report Generation Services
-
Report generation Service
- Sample Work
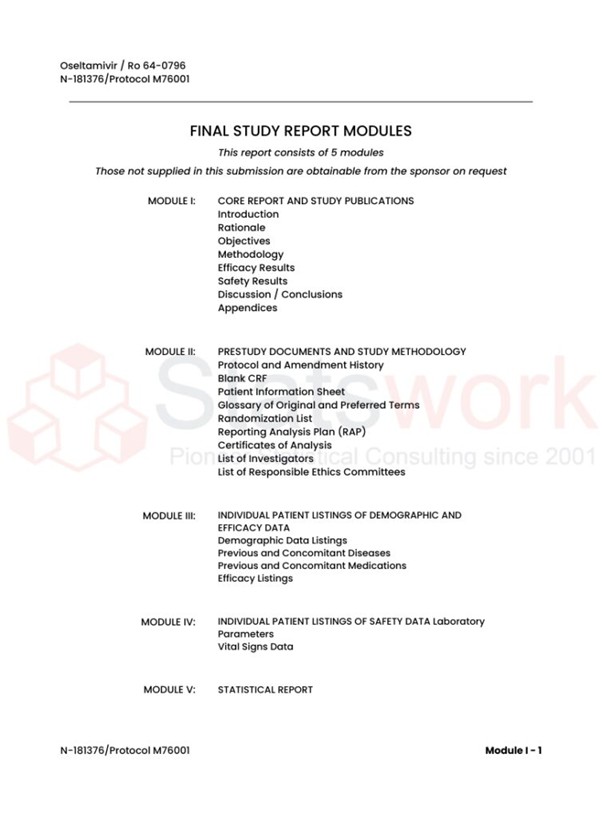
Report generation Services
-
- Data Analysis services
- Industries
- About Us
- Blog
- Insights
- Contact Us
- Services
- Data Analysis services
- Sample Work
Data Analysis services
- Secondary Qualitative Research Services
- Secondary Quantitative Research Services
- Meta-Analysis Research services
- Sample Work
Meta-Analysis Research Services
- Data Collection Services
- Sample Work
Data Collection Services
- Statistical & Biostatistics services
- Sample Work
Statistical Programming & Biostatistics services
- Data Management Services
- Sample Work
Data Management Services
- Research methodology services
- Sample Work
Research methodology services
- Tool Development Services
- Sample Work
Tool development services
- Statistical Interpretation services
-
Statistical Interpretation services
- Sample Work
Statistical Interpretation services
-
- Sample Size Calculation Services
-
Sample Size Calculation Services
- Sample Work
Sample Size Calculation Services
-
- AI & ML Services
-
Artificial Intelligence and Machine Learning Services
- Sample Work
Artificial Intelligence and Machine Learning Services
-
- Meaningful Visualization Services
- Thought Leadership Services
- Report Generation Services
-
Report generation Service
- Sample Work
Report generation Services
-
- Data Analysis services
- Industries
- About Us
- Blog
- Insights
- Contact Us
R Programming for Statistical Data Analysis in Research Projects
Meta Analysis Service
Recommended Reads
Contact us
Summary:
Slow and inaccurate analysis cannot be tolerated by any data team in the enterprise environment – R programming services offer quick and precise statistical modeling, visualizations, and prediction analytics tailored for the needs of large organizations. With the help of R, any company data can be used to create the right strategy that will help to make the right decision in finance, pharmaceuticals, or retail.
Corporate data analysts do not have time to conduct tedious and inaccurate analyses. No matter if you are a financial services company performing a risk model, a pharmaceutical industry doing statistical analysis of the clinical trial, or a retail company predicting the demands in hundreds of stores, the efficiency of R programming providers determines your profitability [1].
Our R Programming Services have been designed just for such cases when you need corporate R statistical analysis, R data visualization, and R predictive modeling services.
What Enterprise-Grade R Programming Support Looks Like
The services of R programming for businesses extend beyond simple programming. They include:
- R programming for data cleaning and wrangling for corporate big data
- Using R programming for statistical modeling for prediction and risk scoring
- Automating using R programming to minimize manual effort in reporting
- Dashboards with R for reporting in real time
- Version control and documentation for R scripts [2]
Example: A financial services client cut monthly risk-reporting time from five days to six hours using automated R scripts.
Why Enterprises Choose Statswork R Programming Services
Business Challenge How R Programming Services Solve It
| Challenge | R-Based Solution |
| Inconsistencies in data across various regions/systems | R data wrangling processes standardize and format data consistently. |
| Reporting takes too long at the end of the month/quarter | R automation and reporting tools significantly reduce turnaround time. |
| Shortage of statistical expertise internally | R programming consulting bridges the knowledge gap. |
| Analyses that cannot be reproduced (“black-box” analyses) | Documented R code development ensures reproducibility and transparency. |
| Outdated or static reports | Interactive R dashboards provide dynamic reports for management [3]. |
Expensive analytic software R open-source language is cheaper than commercial options
R Programming Across Business Functions
- Financial Services & Risk R data analytics consulting provides:
- Credit and fraud scoring models
- Portfolio and market risk simulations [4]
- Regulatory reporting
Example: A regional bank used R machine learning models to flag high-risk transactions 40% faster than its legacy system.
Enterprise uses of Pharma & Clinical Data R programming in clinical studies include:
- Trial data validation & cleaning
- Survival analysis & modeling
- Regulatory statistical reporting
Example: A biotech firm processed Phase II trial data for 500+ patients and delivered FDA-ready statistical summaries in under two weeks.
Retail & Market Research R programming for market research powers:
- Consumer Segmentation and Sentiment Analysis
- Demand Forecasting and Pricing Models
- Large Scale Survey Data Analysis [3]
Example: A consumer goods company used R predictive modeling to forecast seasonal SKU demand across 200+ retail locations.
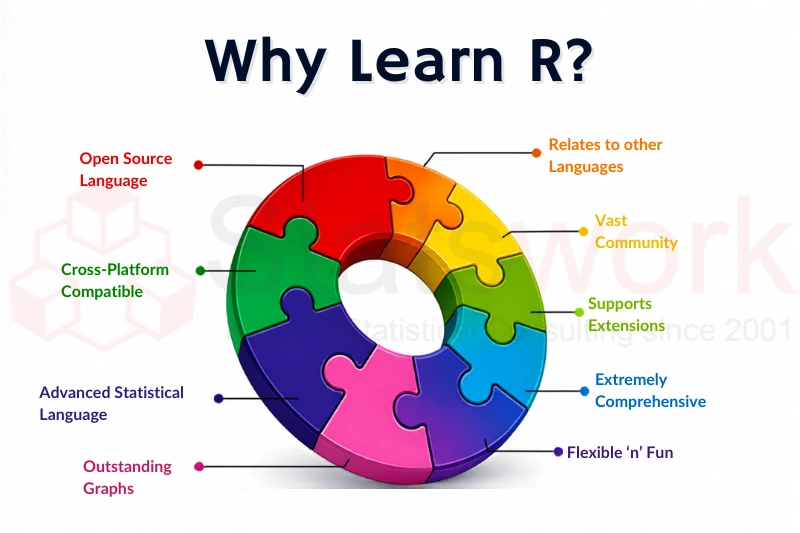
Core R Tools & Packages for Enterprise Analytics
| Package/Tool | Use Case in Business | Example in One Line |
| ggplot2 | R data visualization | Creates business-friendly trend charts within minutes. |
| dplyr / data.table | R data manipulation | Processes millions of transactions efficiently. |
| caret | R machine learning | Evaluates predictive algorithms before implementation. |
| forecast | R statistical modeling | Models future demand and revenue. |
| shiny | R dashboard creation | Builds interactive real-time KPI dashboards. |
Benefits of Partnering with Statswork
- R speed and efficiency — R automation and R optimization reduce the cycle time of reports from day to hour
- Cost savings — no expensive software licensing required due to the use of open-source R programming language
- Reliable knowledge base — access to R programmers’ expertise without the burden of hiring someone full-time
- Audit-proof results — all models and scripts used are reproducible and verifiable
- Presentation-quality visuals — R data visualization done for executive presentations [3]
- Flexible engagement options — from one-off R services project to continuous R consulting services
When to Bring Enterprise R Programming Support
Consider outsourcing when:
- You don’t have enough internal resources for advanced R statistical modeling
- Your reporting cycle is too long to make any business decisions
- You require R programming to conduct clinical trials or in regulated industries
- You don’t have any legacy analytics tool that can handle your data volume
- You prefer dashboards over spreadsheets
Conclusion
For organizations, R programming is not something that they need just to help in their research activities; they require it for business purposes as well [4]. With R data cleaning, R statistical analysis, R predictive models, and R dashboard, organizations can make use of R programming in their efforts of converting raw data into faster and better decisions.
Statswork offers a range of R Programming services which will provide all the advantages that have come to us from our extensive experience of working with corporations in sectors like finance, pharmaceuticals, retailing, and marketing research.
Do you want to benefit from enterprise-level analytics using R programming? Consult with the R programming experts at Statswork today.
Frequently Asked Questions (FAQs)
R is an open-source programming language and software environment used for statistical analysis, data visualization, data manipulation, predictive modeling, and machine learning across research, business, healthcare, and finance.
Yes, R is one of the best tools for statistical analysis because it offers advanced statistical techniques, extensive packages, customizable visualizations, and reproducible workflows, making it widely used by researchers and data analysts.
R is better for advanced statistical analysis, programming flexibility, automation, and large-scale data analysis, while SPSS is preferred by users who need a user-friendly, menu-driven interface for standard statistical procedures.
Yes, RStudio is an integrated development environment (IDE) for R that provides an efficient platform for data cleaning, statistical analysis, visualization, reporting, and developing reproducible analytical workflows.
Yes, R continues to be widely used in 2026 by universities, research institutions, healthcare organizations, financial firms, and businesses for statistical computing, data science, and analytics.
Yes, IBM SPSS Statistics supports R integration through the R Essentials package, allowing users to execute R scripts within SPSS to extend its statistical and data visualization capabilities.
References:
- Giorgi, F. M., Ceraolo, C., & Mercatelli, D. (2022). The R language: an engine for bioinformatics and data science. Life, 12(5), 648. https://www.mdpi.com/2075-1729/12/5/648
- Huber, W., Carey, V. J., Gentleman, R., Anders, S., Carlson, M., Carvalho, B. S., … & Morgan, M. (2015). Orchestrating high-throughput genomic analysis with Bioconductor. Nature methods, 12(2), 115-121. https://www.nature.com/articles/
- Gandhi, M. A., Tripathy, S. P., Pawale, S. S., & Bhawalkar, J. S. (2024). A narrative review with a step-by-step guide to R software for clinicians: Navigating medical data analysis in cancer research. Cancer Research, Statistics, and Treatment, 7(1), 91-99. https://journals.lww.com/crst/fulltext/
- Baumer, B., & Udwin, D. (2015). R markdown. Wiley Interdisciplinary Reviews: Computational Statistics, 7(3), 167-177. https://wires.onlinelibrary.wiley.com/