
- Services
- Data Analysis services
- Sample Work
Data Analysis services
- Secondary Qualitative Research Services
- Secondary Quantitative Research Services
- Meta-Analysis Research services
- Sample Work
Meta-Analysis Research Services
- Data Collection Services
- Sample Work
Data Collection Services
- Statistical & Biostatistics services
- Sample Work
Statistical Programming & Biostatistics services
- Data Management Services
- Sample Work
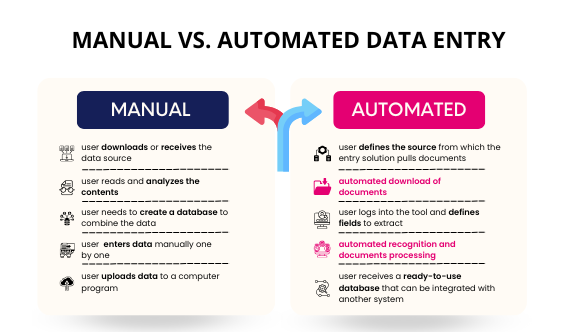
Data Management Services
- Research methodology services
- Sample Work
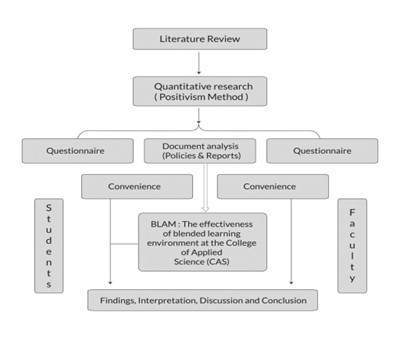
Research methodology services
- Tool Development Services
- Sample Work
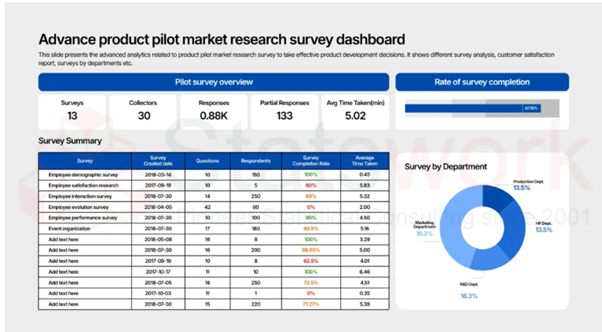
Tool development services
- Statistical Interpretation services
-
Statistical Interpretation services
- Sample Work
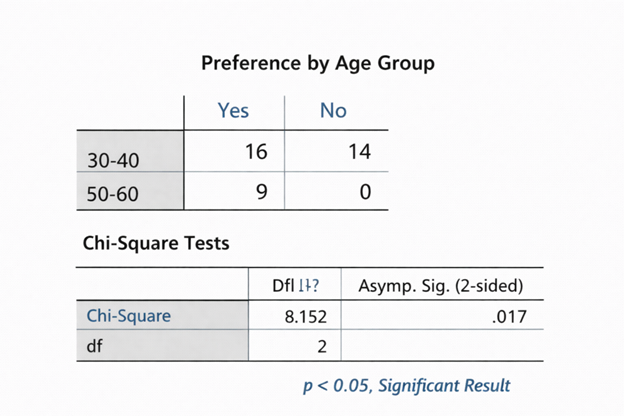
Statistical Interpretation services
-
- Sample Size Calculation Services
-
Sample Size Calculation Services
- Sample Work
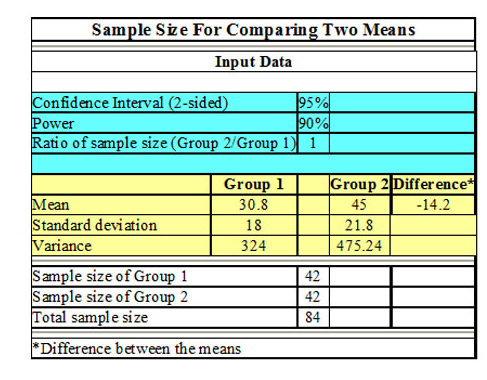
Sample Size Calculation Services
-
- AI & ML Services
-
Artificial Intelligence and Machine Learning Services
- Sample Work
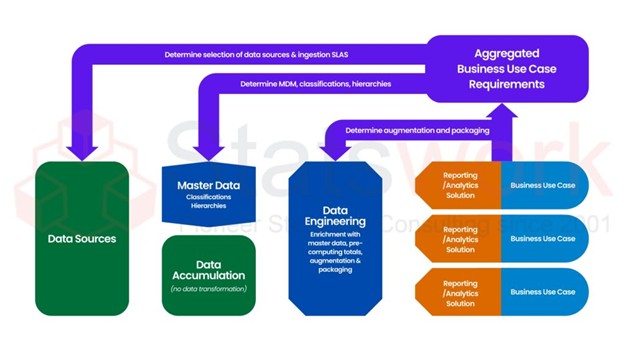
Artificial Intelligence and Machine Learning Services
-
- Meaningful Visualization Services
- Thought Leadership Services
- Report Generation Services
-
Report generation Service
- Sample Work
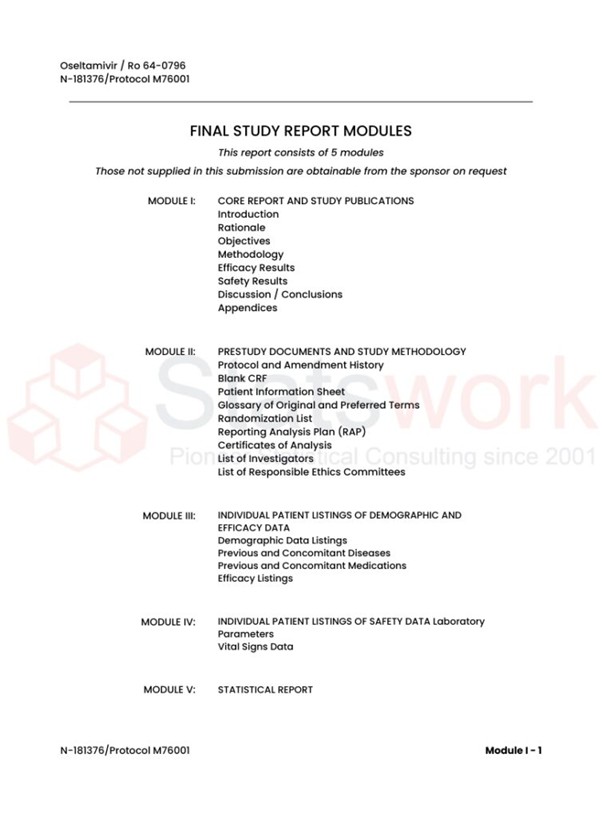
Report generation Services
-
- Data Analysis services
- Industries
- About Us
- Blog
- Insights
- Contact Us
- Services
- Data Analysis services
- Sample Work
Data Analysis services
- Secondary Qualitative Research Services
- Secondary Quantitative Research Services
- Meta-Analysis Research services
- Sample Work
Meta-Analysis Research Services
- Data Collection Services
- Sample Work
Data Collection Services
- Statistical & Biostatistics services
- Sample Work
Statistical Programming & Biostatistics services
- Data Management Services
- Sample Work
Data Management Services
- Research methodology services
- Sample Work
Research methodology services
- Tool Development Services
- Sample Work
Tool development services
- Statistical Interpretation services
-
Statistical Interpretation services
- Sample Work
Statistical Interpretation services
-
- Sample Size Calculation Services
-
Sample Size Calculation Services
- Sample Work
Sample Size Calculation Services
-
- AI & ML Services
-
Artificial Intelligence and Machine Learning Services
- Sample Work
Artificial Intelligence and Machine Learning Services
-
- Meaningful Visualization Services
- Thought Leadership Services
- Report Generation Services
-
Report generation Service
- Sample Work
Report generation Services
-
- Data Analysis services
- Industries
- About Us
- Blog
- Insights
- Contact Us
Significance of Statistical Software in Data Analysis: SPSS & STATA
Meta Analysis Service
- Why Statistical Software Matters for Business
- StataNow: Built for Applied Business and Econometric Analysis
- SPSS: The Standard for Research-Grade Business Analytics
- SPSS vs. Stata: A Business Comparison
- Where SPSS and Stata Deliver the Most Business Value
- Choosing Between In-House Tools and Outsourced Expertise
- Conclusion
Recommended Reads
Contact us
Summary:
There are many statistical packages available which allow businesses to convert complicated data into meaningful insights that will help them make informed decisions. For example, the software called IBM SPSS Statistics is suitable for market research and customer analytics. In turn, another package known as StataNow is the best option for doing econometric analysis and analyzing financial models and panel data. Both packages should be used in combination with professional statistical consultancy services.
Organizations operate using data, but not all the data leads to action and decision making. The process that facilitates this is analysis and in turn, good statistical software plays an important role here. In the context of such business decisions made by an organization, be it a health organization making predictions about patient outcomes, bank calculating risks related to lending or even retail company segmenting customers, statistical package makes decisions based on numbers [1]. For companies which do not have an analytics department, they can resort to statistical consulting and outsourced data analysis services.
Of the many statistical tools, IBM SPSS Statistics and StataNow (StataCorp) are some of the most popular options for enterprises. This article will analyze the importance of such software, compare them and discuss ways in which enterprises can make use of them.
Why Statistical Software Matters for Business
Business intelligence relies on transforming data into insights. Such statistical tools can help in this task due to the application of well-tested methods like regression analysis, ANOVA, MANOVA, t-test, descriptive statistics, time series analysis, and predictive models to business data. That is what differentiates assumptions from facts-based decisions [2].
SPSS is one of the tools that businesses can use for their analysis purposes and compare it to other software like SAS, R programming, MATLAB, or Minitab.
StataNow: Built for Applied Business and Econometric Analysis
StataNow is a product from StataCorp that finds application in economic modeling, finances, and public policies due to its capability to perform sophisticated econometrics and panel data analysis. Both the graphical interface and the command line make the program equally applicable in the hands of experienced analysts and businessmen.
Advantages of StataNow for an enterprise:
- Processes large volumes of complicated data with integrated data cleaning and management system
- Enables advanced econometrics techniques implementation such as time series regressions and panel data
- Provides high-quality graphics and tables generation suitable for board and investors reports
- Provides cross-platform data exchange suitable for the finance department
- Exists in several configurations: multiprocessor version, standard version and large database version [3]
For all these reasons StataNow becomes an obvious choice for the financial department and government statistics due to its ability to forecast, analyze profits and apply econometrics techniques.
SPSS: The Standard for Research-Grade Business Analytics
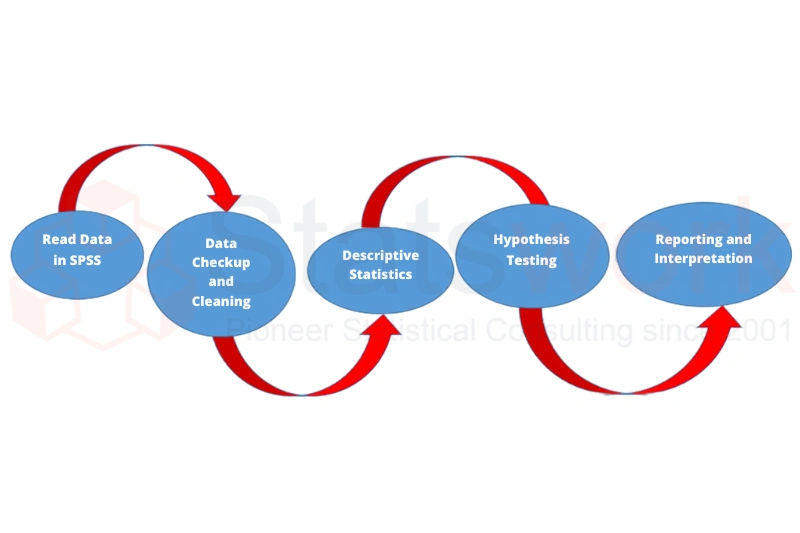
IBM SPSS Statistics is undoubtedly the best choice for businesses that require comprehensive analysis of data related to surveys, markets, and customers. The SPSS Modeler and SPSS Amos options provide the ability to build models for predictive and structural equation analyses along with basic statistics tools available in SPSS – turning SPSS into a tool used for building hypotheses rather than creating reports.
How SPSS helps with enterprise data analysis:
- Data transformation – brings together inconsistent data in one form for analysis
- Regression analysis – measures the relationships between dependent and independent business variables
- ANOVA – compares performance between groups, campaigns or processes
- MANOVA – works with several output variables at once – comes handy for market segmentation and customer analysis [4]
This set of features makes SPSS a useful tool for predicting churn, analyzing customers’ behavior and HR analytics where companies need to discover reasons behind certain patterns.
SPSS vs. Stata: A Business Comparison
| Criteria | IBM SPSS Statistics | Stata Now (Stata) |
| Best suited for | Survey data, market research, customer analytics | Econometric analysis, panel data analysis, policy analysis |
| User interface | Mostly menu driven, simple to use | Menu driven and command line, popular among programmers and analysts |
| Add-ons | SPSS Modeler (for predictive analytics), SPSS Amos (SEM) | Many user-defined and official commands |
| Common industry users | Retail, healthcare, human resources, market research | Finance, economics, government, research institutions |
| Cost | Varied SPSS pricing depending on modules required | Varying costs of Stata licensing depending on edition (IC, SE, MP) |
However, both programs do not fit in with either open source or commercial packages such as R and Python used for statistics [3]. Open-source solutions give flexibility and lack of license fees, whereas SPSS and Stata provide tested solutions with official support that is popular within regulated companies. In recent years, many organizations began using both together – SPSS/R/Python combination or Stata with Python.
Where SPSS and Stata Deliver the Most Business Value
- Biostatistics and health care analytics – clinical trial data analysis, treatment effect comparison, epidemic modeling
- Finance analytics – risk modeling, forecasting, profitability analysis
- Human resource analytics – turnover modeling, human resource planning, performance analysis
- Governmental statistics – policy assessment, census data analysis, surveys
- Business strategy – market segmentation, customer profiling, business intelligence reporting
Choosing Between In-House Tools and Outsourced Expertise
The mere licensing of either SPSS or Stata is only the first step towards producing meaningful results. The latter requires proper model specifications, correct data and interpretation – all tasks that are extremely difficult for many internal units. For this reason, an increasing number of companies rely on corporate statistics and SPSS or Stata consulting services for business, rather than assembling large analytics departments from scratch. Statistical analysis software consulting provides companies with access to qualified statisticians as needed.
Conclusion
The statistical software strategy remains with SPSS and Stata, where SPSS is more suited for accessible research-oriented business analysis while Stata caters to more rigorous econometrics and panel data analysis [4]. Whether you pick either of the two or go along with options such as SAS, R and even Python will depend upon your industry and the nature of the data that you need to analyze. Statswork offers consultancy for SPSS, Stata as well as other data analysis services.
Frequently Asked Questions (FAQs)
Statistical significance in Stata indicates whether the results of a statistical test are unlikely to have occurred by chance, helping researchers determine if relationships or differences in the data are meaningful.
SPSS is significant because it simplifies data management, statistical analysis, and reporting, enabling businesses and researchers to make accurate, data-driven decisions.
SPSS and Stata are powerful statistical software packages used for data management, statistical analysis, predictive modeling, and visualization across research, business, healthcare, and finance.
Statistical significance is important because it helps determine whether observed patterns or relationships in the data are genuine and reliable rather than occurring by random chance.
A 5% statistical significance level (p < 0.05) means there is only a 5% probability that the observed results occurred by chance, making it the most commonly used threshold for hypothesis testing.
The seven common types of statistical analysis are descriptive analysis, inferential analysis, predictive analysis, prescriptive analysis, exploratory data analysis (EDA), causal analysis, and mechanistic analysis.
References:
- Skender, F., & Ali, I. (2022). Big data in health and the importance of data visualization tools. Akıllı sistemler ve uygulamaları dergisi, 33-37. https://joiswa.com/index.php/joiswa
- Ali, Z., & Bhaskar, S. B. (2016). Basic statistical tools in research and data analysis. Indian journal of anaesthesia, 60(9), 662-669. https://www.ovid.com/jnls/ijaweb/
- Aryadoust, V., & Jia, Y. (2026). Univariate normality checking practices in L2 research: An AI-assisted systematic review. Studies in Second Language Acquisition, 1-36. https://www.cambridge.org/core
- Heinze, G., Wallisch, C., & Dunkler, D. (2018). Variable selection–a review and recommendations for the practicing statistician. Biometrical journal, 60(3), 431-449. https://onlinelibrary.wiley.com/doi/full