

What are different types of data analysis and statistics applied for Political Campaigns?
In-Brief
- Twitter data plays a vital role in expressing their thoughts about the election or any political party by mentioning them in the tweets that proved to be a valid data resource for election prediction.
- Sentiment analysis is a field which is dominantly used around the opinion analysis. It is a sub-division of Natural Language Processing (NLP) which helps to determine the polarity of the textual data.
Introduction
In recent days election forecasting has attracted lots of attention. The poll survey helps Political science, which uses economic growth of the nation as the predictive factor. Suggestion polls help estimate the influence of political parties participating in elections, the publicity of persons, evaluative classification of problems and representatives who took part in the election. After the voting process, the results are elaborated and analyzed with specialized statistical techniques targeting to serve the pre-electoral statements and attitudes of the political parties.
Analysis of the subpopulation
While publishing the analyzed results, many journalist and analyzers forget that the value they are usually evaluated percentages which are not the exact value but only predictions. They fail to understand the confidence interval concept, which means the prediction parameter; for example, the percentage of a political party is found between the upper and lower limit with exactly the same probability. Data analysis services help in gathering survey details.
All most all the political parties are fascinated in the behavioral analysis of the subpopulation of people. The designed sample population represents the general population, which does not mean that every part indicates the subpopulation. Which it comes from, some exceptional cases found in the subpopulation. Which are elaborated as follow,
- There might be a chance that supporter of some party can found in the subpopulation, who will not be considered as the representatives of the sample.
- The new voter group of age from 18 to 25 are not necessarily considered as the representative of all the youth.
The use of two-way table method analysis or correspondence analysis can lead to misjudgment and fault. Statistics does not contain any complete rules and recipes for the data analysis. If you need any details regarding the statistical analysis, you can get help from online statistical analysis services providers, to get a perfect survey result. It does not help in complicated computerized programs and graphs. It requires an effective understanding of the observed phenomenon, the structuring of observation, understanding about the collected data, and description and examination of suggestions for the parameters of the analyzed phenomenon.
Some of the different type of data analysis method used in political campaigns
- Location & Demographics Analysis
The different region tends to fascinate people that fall under similar demographic categories, based on this campaign, advertisements, events, etc., are organized. The demographic analysis helps collect information about the participant, who is taking part in the election, which helps in the survey question. It also helps political parties and representative to understand much about the neighborhood. Which is necessary to decide before where to spend, how to advertise via paper ads, offline, radio, announcement boards, etc. or through online service like website, social media, etc., take a careful look at participants, through which they are contacting.
If you have zip code of participants, carefully look at the place they reside in living in the city or village and why. There are various free data online for demographic analyzing by zip code, for example, can be analyzed using various tools like Microsoft Excel, or Google Sheets. If you are just starting up with demographic analyzing, you can sign up with Microsoft BizSpark and excel for free as you are getting started. Survey data analysis services online help to gather effective information, which helps in framing the survey question.
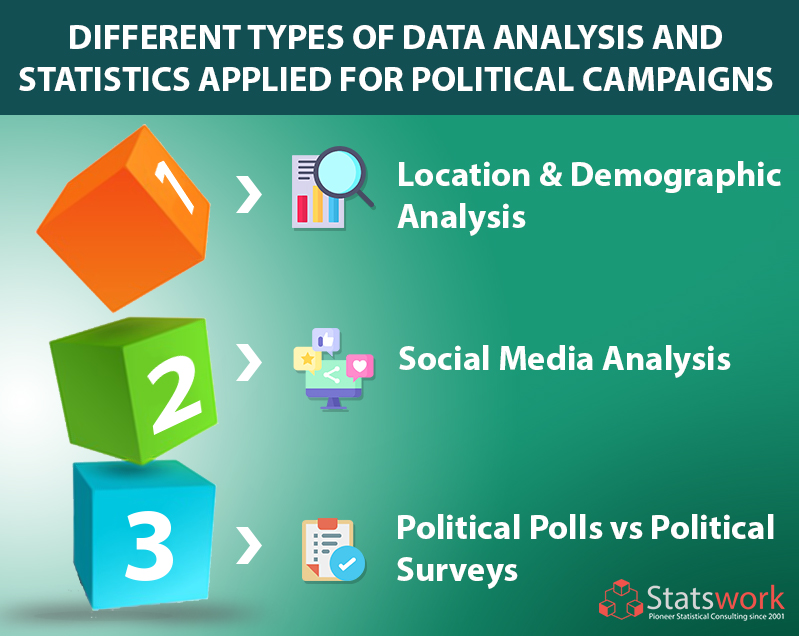
- Social Media Analysis
In recent days election forecasting has attracted lots of attention. The poll survey helps Political science, which uses economic growth of the nation as the predictive factor. However, dense polling is always expensive and hard to conduct. In recent days, aggressive growth of social attracted several researchers interest from various disciplines. Current researches reveal that social media data can reflect the political landscape. Especially, Twitter data plays a vital role in expressing their thoughts about the election or any political party by mentioning them in the tweets that proved to be a valid data resource for election prediction. It is one of the famous social media platforms used in predicting election outcomes. It uses sentimental analysis method. Many of the researches correlate Twitter sentiment directly and solely with the election outcomes, which can hardly be regarded as predictions. If you feel difficult in gathering data, you can get help from data analysis services providers.
Sentiment analysis is also called opinion mining is a field which is dominantly used around the opinion analysis. It is a sub-division of Natural Language Processing (NLP) which helps to determine the polarity of the textual data. The polarity of textual data is used to find out the originality of the sentiments of the given textual data, whether they are positive, negative, or neutral. It can be done in five different levels word-level, sentence-level, document-level, aspect-level concept-level sentiment analysis.
At aspect-level sentiment analysis, features or aspects of a product or any other entity analyzed are selected as targets and attitude towards these targets is found. In Concept-level sentiment analysis, words in opinionated texts having similar meanings are denoted and considered as the same concept. Further, concept-based sentiment analysis goes beyond the word-level sentiment analysis of text and provide novel ways to perform the task of sentiment analysis and opinion mining.
Volumetric approach
The volumetric approach is used to predict the election result, purely based on the volume of the social media followers, likes, post and shares about their favorite party or representatives taking part in the election.
Social network analysis approach
In this approach, the network of the online users is analyzed whom they are supporting or what are the current discussion popularly spoken on the social media about the electoral process. Political parties are analyzed by measuring centrality method, i.e. incoming, outgoing, or bidirectional links in a graph structure.
- Political Polls vs Political Surveys
A political poll is used to inquire simple question and does not gather any other data from the poll taker. In contrast, a political survey supports multiple questions and often gather demographic data and other details.
Few tips about the political poll, some example question asked in political pools
- Whom will you vote in the coming election?
- Option A
- Option B
- Option C (Which contains the name of the person)
Whereas political survey, on the other hand, helps to enquire a variety of questions.
A political survey helps in asking multiple questions. After gathering some essential demographic information (such as age, race, and sex), political survey questions could include:
- Will you be voting in the coming election? (yes or No )
- If yes, whom will you vote? (name of the candidates)
- Option A
- Option B
- Option C
- If no, what the reason for not taking part in voting?
- Don’t like the candidates
- Not registered to vote
- Not legal to vote
- Other
- Asking reason, why are they voting for the particular candidate? (select all that apply)
- Policies
- Familiarity
- Character
- Whom do you expect to win the election?
- Option A
- Option B
- Option C
Accompanying Surveys before an Election
Most of the political polls are still conducted via telephone. Experts suggest getting an accurate election forecast there must be at least 800 responses, which used to be easy in 1997 that is before the spread of caller ID, pollster’s suspect they need to attend at least 2,000-2,500 calls to reach 800 responses.
Today, most of the political polls are conducted via telephone. To get precise election forecasting, experts suggest, that a pollster must collect 800 responses. That used to be easy; in 1997, before the widespread use of caller ID, pollsters could expect that they would need to place 2,000-2,500 calls to reach 800 responses. Today, it takes between 7,500-9,000 calls to reach that magic number, greatly increasing costs. the main task is, how they reach 800 in a country of 325 million., according to hardware review, the math works out if the sample is truly random, to attain randomness, telephonic polls uses the random-digit-dial system, which is a computer-based system.
Of course, today many peoples use mobile cell phones, which the federal regulations require to dial manually, not through a computer, further increasing the cost of political polling by telephone.
Conclusion
Statistics is related to mathematical science that includes Data collection, analysis of data, explanation, reporting the data, interpretation, and finally providing of the enormous amount of data to determine the underlying patterns and trends. Statistical methods are practiced in daily life in various fields like research, industry and government, and they aim to become more scientific about the decisions that are needed to be made.
Reference
Chauhan, P., Sharma, N., & Sikka, G. (2020). The emergence of social media data and sentiment analysis in election prediction. Journal of Ambient Intelligence and Humanized Computing, 1-27.
Ramteke, J., Shah, S., Godhia, D., & Shaikh, A. (2016, August). Election result prediction using Twitter sentiment analysis. In 2016 international conference on inventive computation technologies (ICICT) (Vol. 1, pp. 1-5). IEEE.
 Previous Post
 Next Post