
What are the different qualitative data analysis methods? Mention the steps in qualitative data analysis.
October 16, 2020
The theory of multilevel models and present applications of multilevel models as well as software for fitting such models
October 22, 2020What is the common mistake researchers do while analyzing the result of the survey questionnaire? Mention the measures to take while analyzing survey questionaries.
Meta Analysis Service
Recommended Reads
Contact us
What is the common mistake researchers do while analyzing the result of the survey questionnaire? Mention the measures to take while analyzing survey questionaries.
In-Brief
- Questionnaire survey results often used to compute mean scores for individual questions or groups of related questions.
- Questionnaire Hypothesis Survey likely to hold the assumptions that come from comparing scores across different lectures and models.
- Business research survey questionnaire analysis service helps to calculate the proportion of respondents answering for each category of each question.
Introduction
Even the experienced researchers have small issues while analyzing the survey questionnaire that compromises quality, introduce bias or may mislead the research. At the same time, the mistakes are obvious. They need an experienced person to handle the Survey questionnaire analysis with every possible stage of the issue in mind to full quality data from the survey.
The common questionnaire mistakes researchers should evade,
1. Overlapping, Incomplete or Unclear Response Choices:
It is the common type of mistake that researcher commits while Analyzing the survey questionnaire. The analyzing procedure should be obvious to get an accurate result. The response of Hypothesis testing using complex survey data is not all the time is of good quality some times it will confuse and frustrate the respondent. Most of the researchers commit this mistake by including these type of response to make the result only some experienced researchers know this and evade these type of responses.
2. Vague responses:
If the analysis is looking forward at something specific, these type of questions have a high chance to lead to an unknown vague response from the respondent. Because these type of responses do not have any options the respondent, should have informed their own experience. It takes the response into different directions that has a high chance to confuse the analyzer. Survey questionnaire Analysis & Reporting helps by making a clear view of the topic and have a clear perspective.
3. Open-ended question:
Steps involved in analyzing the open-ended question is placed by getting all the available data into the template. So the first step to evaluate open-ended question is to organize the survey poll data to the datasheet. The next step is to separate the response based on their categories for easier identification.
Online dissertation survey questionnaire help in a different type of survey that records individual responses and searches for useful responses. This method will be helpful to notice trends and can add insights. One of the most significant advantages of analyzing this type of method is the data from this method represent data visual that is helpful to get a clear view and provide a relevant outcome.
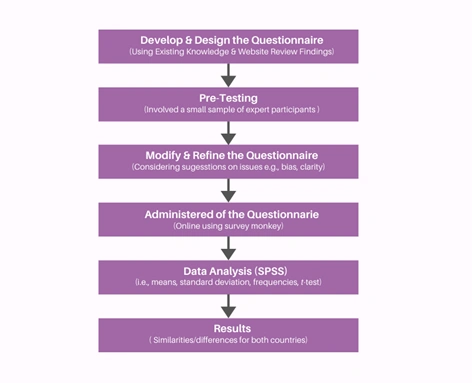
Analyzing the data:
The process of analyzing the data with useful tips and discussion are as follows,
Preparing a grid:
If there is the presence of a large number of data to analyze the easiest method to store and interpret the response is by preparing the grid. Research Questions and Hypothesis Development service uses this method to analyze the data. A typical grid looks like,
Questions
| 1 | 2 | 3 | 4 | 5 | 6 | 7 | 8 | 9 | 10 | |
| Respondent 1 | ||||||||||
| Respondent 2 | ||||||||||
| Respondent 3 | ||||||||||
| Respondent 4 | ||||||||||
| Respondent 5 |
Coding data:
If the answer represented in the format as the point on scale from 1 to 10, usually you will enter this number directly into the grid. If the answer takes the different form, you wish to translate them into a numerical format. To do this type of analysis, you will need to construct code to describe missing information or answers that do not follow as per the instructions, for example, if some respondents select more than one category.
Analyzing survey data
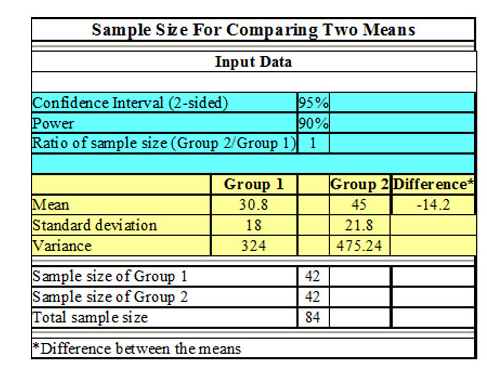
Ensure the sample size is sufficient:
Ensure you have a sufficient sample size before starting the analyzing step, Master’s / PhD dissertation questionnaire development helps to calculate how many peoples you need to survey to get accurate results.
Suppose you are working with larger sample size, more reliable result. Larger sample size does often equate to needing a more significant budget though. One of the easiest ways to evade this issue is to perform sample size calculation before starting the survey.
Focus on your insights, not the data:
When representing your outcome, it’s acceptable to highlight the insight derived from the data than explaining the data itself. At this step, you should explain the need for the study and how to get rid. If you demonstrate the insight beyond sharing the percentage, the data breakdown occurs.
Complement with other types of data:
Don’t stop your research with the data that you analyzed, when presenting your insights, and it’s always helpful to use different data points that might even include personal experience. Research Questionnaire and Hypothesis Development uses qualitative research information to get support for the data. Be sure to let the target audience know when you are showing them findings from the statistically significant study and when it comes from a different source.
Conclusion
There is numerous tool in the market to analyze the output all with different features and benefits. The important part of getting the right tool completely relies on data count, type of analysis, should be flexible enough to adapt the needs. Survey questionnaire development sample for dissertation assist in getting a relevant tool to analyze based on data requirement.
References
- O’donnell, O., Van Doorslaer, E., Wagstaff, A., & Lindelow, M. (2007). Analyzing health equity using household survey data: a guide to techniques and their implementation. The World Bank.
- Kiecolt, K. J., Brinberg, D., Auspurg, K., Nathan, L. E., & Nathan, L. E. (1985). Secondary analysis of survey data (Vol. 53). Sage.
- Fink, A. (1995). How to analyze survey data (Vol. 8). Sage.
- Biemer, P. P., Groves, R. M., Lyberg, L. E., Mathiowetz, N. A., & Sudman, S. (Eds.). (, 2011). Measurement errors in surveys (Vol. 173). John Wiley & Sons.