
PLS Regression analysis Services from Statswork Experts
Partial Least Squares (PLS) regression method is one of the models constructing method like regression analysis. This method is appropriate while high collinear exist between independent variables. If the model contains high collinear between independent variables, it will lead to false result during which we can perform PLS regression.
Data format:
Before going to start the regression analysis, we have to check the correlation between the independent variables. If the correlation value is zero between the independent variables, we can use linear or multiple regression analysis based on the data. If the correlation value is non-zero, then we must use the Partial Least Square regression analysis.
What Statistical consultation Services we offer at PLS regression?
The output and their descriptions are as follows:
Convergent validity
Convergent validity specifies that items that are indicators of a construct should share a high proportion of variance [199 - PLS-SEM: Indeed a silver bullet. 2011. Hair,Joe]. Individual item reliability was assessed by investigating the indicator’s weight (relative importance) and loading (absolute importance) of the items on their respective construct. Examination of results showed that all the indicator weights are significant, and hence there is empirical support to keep all the indicators [199 - PLS-SEM: Indeed a silver bullet. 2011. Hair,Joe].
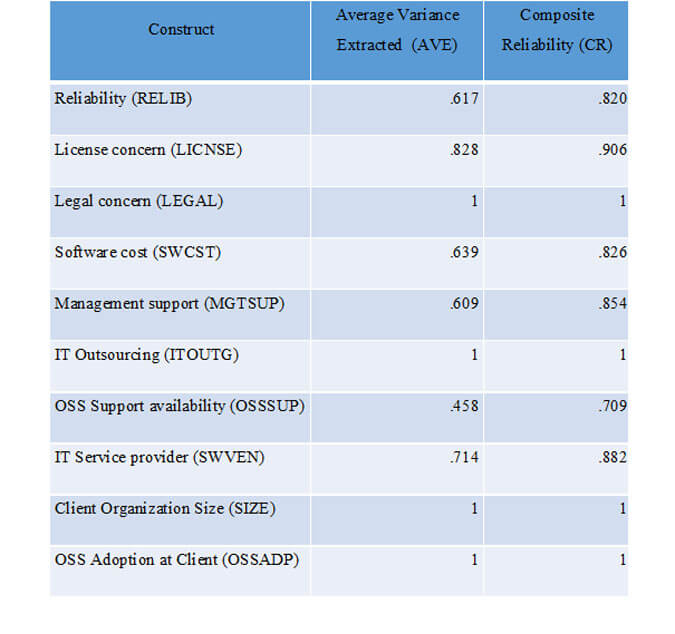
Table 1 shows that Composite Reliability (CR) was above 0.70 recommended in the literature ([199 - PLS-SEM: Indeed a silver bullet. 2011. Hair,Joe]; [209 - The partial least squares approach to structural equation modeling. 1998. Chin,Wynne]) indicating the Internal consistency reliability. In addition, the Average Variance Extracted (AVE) was above 0.50([199 - PLS-SEM: Indeed a silver bullet. 2011. Hair,Joe]; [209 - The partial least squares approach to structural equation modeling. 1998. Chin,Wynne]), except for OSS Support availability (OSSSUP), which was close at 0.460. However, as this factor is minimally correlated with the other factors in the model, and because the Cronbach’s alpha (0.606) was greater than 0.6 and Composite Reliability (0.706) was greater than 0.7, this was retained. These results provide support for convergent validity.
Discriminant validity
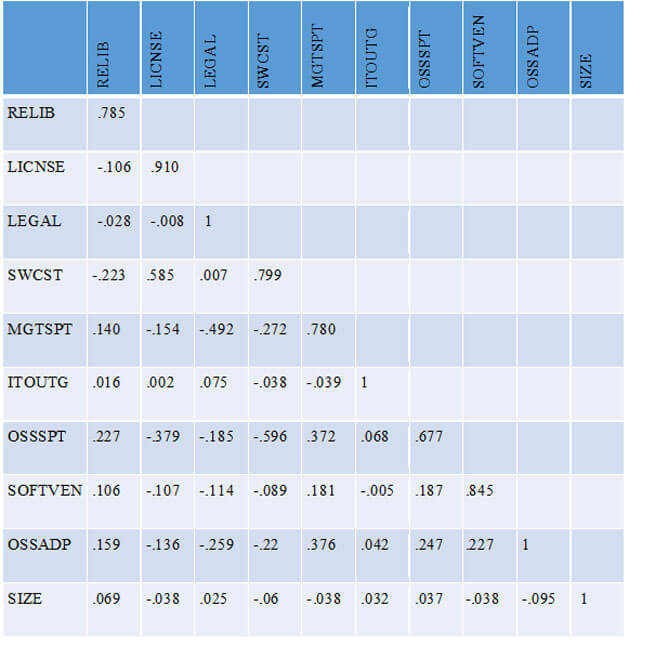
Discriminant validity was ascertained by verifying that the square root of the Average Variance Extracted (AVE) is higher than all the inter-construct correlations [209 - The partial least squares approach to structural equation modeling. 1998. Chin,Wynne]. As Table 2 shows, this criterion was satisfied. A second means for investigating discriminant validity was by examining the cross-loadings. The results from the PLS factor analysis are shown in Appendix C-4. Each item loads higher on the construct it intends to measure, than on any other construct [209 - The partial least squares approach to structural equation modeling. 1998. Chin,Wynne]. In addition, the loadings in each construct block are higher than the cross-loadings of the construct with items from other constructs. As a result, both tests indicated that the model has a sufficient level of discriminant validity.
Common method bias
Since the data collection was based on a single survey, recommended procedural and statistical remedies suggested by Podsakoff et al [210 - Common method biases in behavioral research: a critical review of the literature and recommended remedies. 2003. Podsakoff,Philip] were applied to minimize and control common method bias. Harman’s single-factor test was conducted to test that neither one single factor emerged that accounted for the majority of the variance in neither the model nor one factor accounted for more than 50% of the variance. Principal axis factoring without rotation revealed seven distinct factors with eigenvalues above 1 emerged, explaining 57% of the variance. The most prominent component accounted for 19% of the variance.
In addition, marker variable procedure as suggested by Lindell and Whitney[211 - Accounting for common method variance in cross-sectional research designs. 2001. Lindell,Michael]was applied. Marker variable (OSS component selection criteria), which was theoretically dissimilar to the other constructs in the model was added. Latent variable correlations were low. The maximum correlation with marker variable was with Software Vendor (.177) and this was less than 0.300. Maximum shared variance with the Marker variable was less than 3.2% (.177 squared), and none of the other correlations were near the 0.900 threshold. Thus, there was no evidence that a common method bias exists in the study.
Assessment of the Structural model
A structural model is used to capture the linear regression effects of the endogenous construct upon one another[196 - Multivariate Data Analysis. 2010. Hair,Joseph]. It has the ability to specify the pattern of the relationships among the constructs (Leohlin, 1998). The model was assessed using PLS as defined in three criteria: a) path coefficients (β); b) path significant (p-value); and c) variance explain (R2).
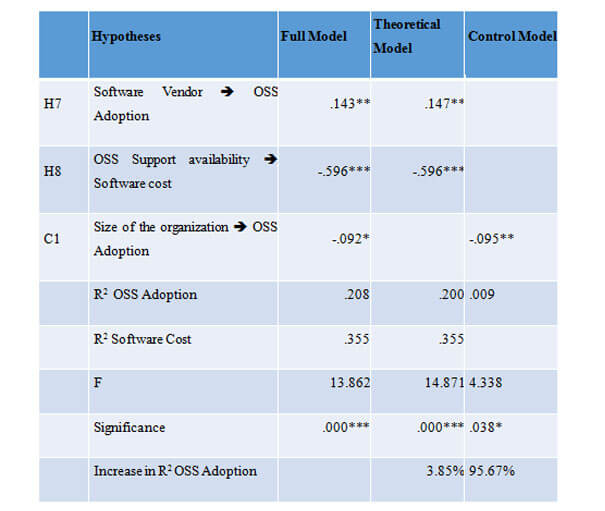
Bootstrapping procedure was performed using 5000 resamples and construct level sign-changes to assess the significance of the path coefficients.Since the paths were unidirectional in nature, a one-tailed t-test was used (Teo et al., 2003).Similar to previous studies (see e.g., [113 - An empirical investigation into the assimilation of open source server software. 2011. Ven,Kris]; Fichman and Kemerer, 1997; Ravichandran, 2005; Teo et al., 2003), three different models were estimated, namely (1) the theoretical model, (2) the control model, and (3) the full model. An evaluation of these three structural models is shown in Table 3. It can be seen that the R2-value of OSS adoption in all models is significant. Next, the impact of control variables in the model was assessed to check if there was a substantial increase in the explained variance in the dependent variable, by calculating the corresponding F-statistic for including additional variables into the model. Results show that the full model is superior to both the control model and the theoretical model: it explains 95.6 percent and 3.8 percent more variance respectively. In addition, both F-statistics are highly significant (p < .001). Hence, the full model offers a better explanation of OSS adoption than the theoretical model.
The results of the structural model can be found in Figure 1. The R2-value of OSS adoption, the dependent latent variable of main theoretical concern, is 20.8 percent. The primary evaluation criteria for the structural model are the R2 measures and the level and significance of the path co-efficient. Because, the goal of the prediction-oriented PLS-SEM approach is to explain the dependent latent variables’ variance, the key target constructs’ level of R2 should be high. The judgment of what R2 level is high depends, however, on the specific research discipline [199 - PLS-SEM: Indeed a silver bullet. 2011. Hair,Joe]. Whereas R² results of 0.20 are considered high in disciplines such as consumer behavior, such results would be considered weak in marketing research studies [199 - PLS-SEM: Indeed a silver bullet. 2011. Hair,Joe]. This study of OSS Adoption in IT outsourcing organizations is a form of consumer behaviour research (Lars defines consumer behaviour as study of individuals, groups, or organizations and the processes they use to select, secure, and dispose of products, services, experiences, or ideas to satisfy needs and the impacts that these processes have on the consumer and society[212 - Consumer behavior: the psychology of marketing. 2010. Perner,Lars]).This means that the present model is able to explain a relatively high portion of the variance in the dependent variable.