
- Services
- Data Analysis services
- Sample Work
Data Analysis services
- Secondary Qualitative Research Services
- Secondary Quantitative Research Services
- Meta-Analysis Research services
- Sample Work
Meta-Analysis Research Services
- Data Collection Services
- Sample Work
Data Collection Services
- Statistical & Biostatistics services
- Sample Work
Statistical Programming & Biostatistics services
- Data Management Services
- Sample Work
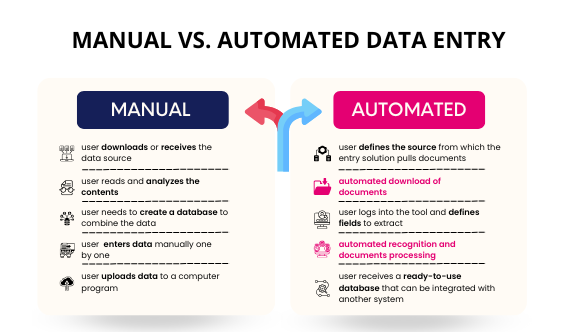
Data Management Services
- Research methodology services
- Sample Work
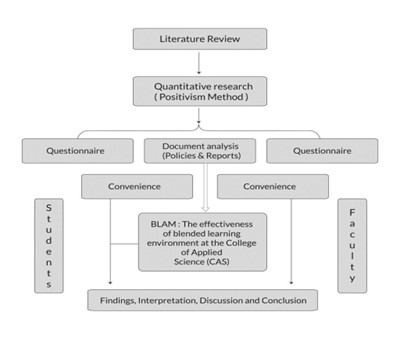
Research methodology services
- Tool Development Services
- Sample Work
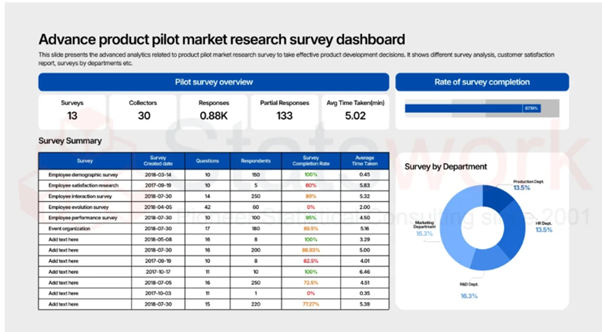
Tool development services
- Statistical Interpretation services
-
Statistical Interpretation services
- Sample Work
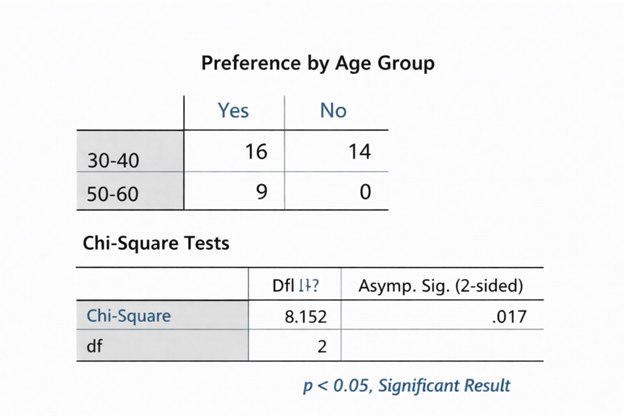
Statistical Interpretation services
-
- Sample Size Calculation Services
-
Sample Size Calculation Services
- Sample Work
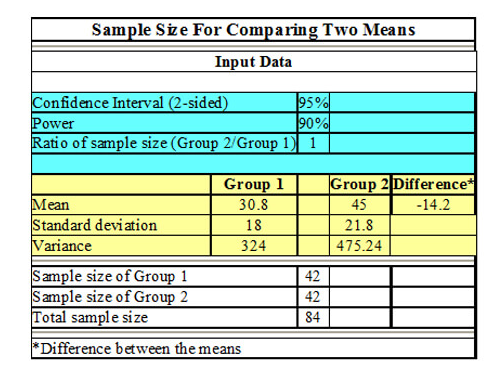
Sample Size Calculation Services
-
- AI & ML Services
-
Artificial Intelligence and Machine Learning Services
- Sample Work
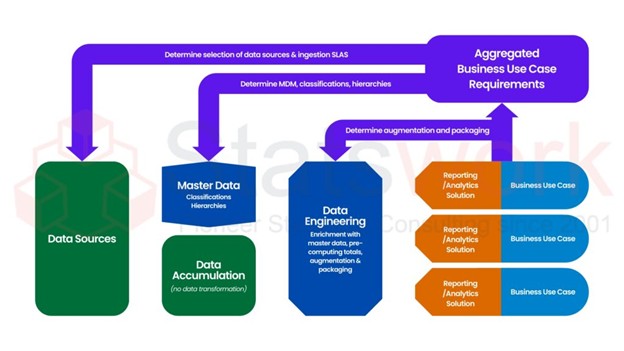
Artificial Intelligence and Machine Learning Services
-
- Meaningful Visualization Services
- Thought Leadership Services
- Report Generation Services
-
Report generation Service
- Sample Work
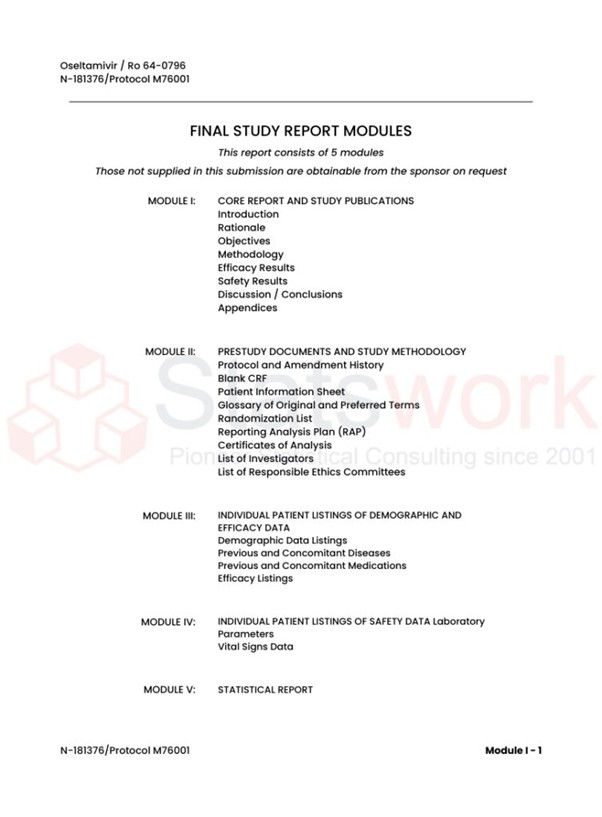
Report generation Services
-
- Data Analysis services
- Industries
- About Us
- Blog
- Insights
- Contact Us
- Services
- Data Analysis services
- Sample Work
Data Analysis services
- Secondary Qualitative Research Services
- Secondary Quantitative Research Services
- Meta-Analysis Research services
- Sample Work
Meta-Analysis Research Services
- Data Collection Services
- Sample Work
Data Collection Services
- Statistical & Biostatistics services
- Sample Work
Statistical Programming & Biostatistics services
- Data Management Services
- Sample Work
Data Management Services
- Research methodology services
- Sample Work
Research methodology services
- Tool Development Services
- Sample Work
Tool development services
- Statistical Interpretation services
-
Statistical Interpretation services
- Sample Work
Statistical Interpretation services
-
- Sample Size Calculation Services
-
Sample Size Calculation Services
- Sample Work
Sample Size Calculation Services
-
- AI & ML Services
-
Artificial Intelligence and Machine Learning Services
- Sample Work
Artificial Intelligence and Machine Learning Services
-
- Meaningful Visualization Services
- Thought Leadership Services
- Report Generation Services
-
Report generation Service
- Sample Work
Report generation Services
-
- Data Analysis services
- Industries
- About Us
- Blog
- Insights
- Contact Us
What is the main category of quantitative approaches in research?
Meta Analysis Service
- The Four Core Quantitative Research Approaches
- Correlational Research: Identifying Relationships
- Experimental Research: Testing Causal Relationships
- Causal-Comparative Research: Understanding Differences Between Groups
- Implementing Quantitative Research in Your Organization
- Why Organizations Choose to Outsource Quantitative Research
- Conclusion: Building Data-Driven Organizations
Recommended Reads
Contact us
Summary:
Understand the Four Primary Quantitative Research Methods—Descriptive, Correlational, Experimental, and Causal-Comparative—that enable organizations to convert unorganized data into strategic decisions based on facts. The article provides insight into the use of each method to achieve objectives within an organization, using practical examples from corporations such as finance, retail, e-commerce, and manufacturing sectors. Find out when to conduct quantitative research in your organization and understand why leading organizations prefer to outsource quantitative data analysis services.
Nowadays, in an era of information, the key question is how to derive useful and relevant knowledge out of the abundance of data available. The solution for this lies in knowing how to apply the correct quantitative research methods. With these methods, organizations will be able to derive useful knowledge and make evidence-based decision-making and hypothesis testing [1]. Many organizations have benefited from our quantitative data analysis services at Statswork.
It is very important to know about the basic types of quantitative research to develop statistical soundness in decision making in an organization [5]. This guide will help you understand the four basic types of quantitative research that rule both corporate and academic world.
The Four Core Quantitative Research Approaches
There are four general methods used for quantitative research. Each of these methodologies is designed for specific purposes within business environments. Data analysis methods have been developed and perfected over many years of research.
1. Descriptive Research: Understanding Your Current State
Descriptive research serves as the base for quantitative research since it provides descriptions of phenomena, populations, and trends [1]. It answers a fundamental question, “What is going on in our market or organization?
Business Application:
A financial services company performs descriptive research to measure their customers’ level of satisfaction across multiple channels. They survey 5,000 of their customers and use descriptive statistics to analyze the information collected; it is found that the mobile banking customer satisfaction rate is 78% while that of branch interaction is 85%.
Descriptive research operates through:
- Survey research methodology – Standardized data collection from a specified population
- Observation research with protocol – Recording of behavior or phenomena systematically
- Differentiation between primary and secondary research analysis – Incorporating new data with existing database analysis
- Database analysis using statistical method – Using organization’s data for identifying patterns
Statistical measures such as the mean, median, standard deviation, and frequency distribution help companies to set benchmarks and track performance trends [3]. Appropriate sampling methods and sample sizes can improve the precision and generalizability of descriptive findings, although representativeness depends on the sampling design and target population.
2. Correlational Research: Identifying Relationships
Correlation research studies the magnitude and nature of the relationship between two or more variables without manipulating them. This method helps in understanding how the variables change in response to each other.
Business Application:
The following example involves a retail firm’s use of correlation research to determine the link between the number of hours spent on training and customer satisfaction indicators. After analyzing data from 150 stores with varying training investments, the company’s analysts find a correlation coefficient of +0.78, which shows that there is a strong link between training and customer satisfaction.
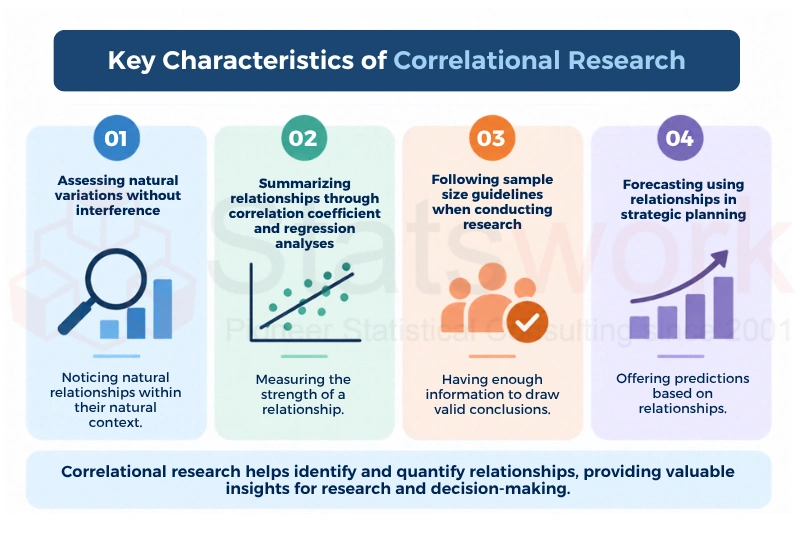
Correlation coefficients range from -1.0 to +1.0, where values closer to these extremes indicate stronger relationships [2]. Organizations use correlational findings to make predictions and identify variables worthy of deeper experimental investigation Correlational analysis can identify the strength and direction of associations between variables and can support prediction when the analytical model is appropriate. However, correlation alone cannot establish that one variable causes another. Confounding, reverse causation, measurement error, and other sources of bias may explain an observed association. Therefore, correlation should be interpreted as evidence of a relationship rather than proof of a causal effect
3. Experimental Research: Testing Causal Relationships
Experimental research is particularly useful when the objective is to evaluate whether a controlled intervention produces a change in an outcome. Researchers manipulate an independent variable and compare outcomes between intervention and control conditions. When randomization and other design requirements are appropriately implemented, experimental designs can provide strong evidence about causal effects [3]. This research technique enables organizations to conduct “what if” experiments scientifically.
Business Application:
The e-commerce website performs an experiment to ascertain whether making the checkout process easier would increase their conversion rate. The website randomly assigns 100,000 customers into the control and experimental groups. The experimental group is subjected to an easy checkout process while the control group goes through the normal process. For example, suppose an experiment found a 23% increase in conversion in the conversion rate of the experimental group. This causal data comes from a well-conducted experiment.
Experimental research features:
- Randomization of control group assignments — Creating equality among the comparison groups prior to treatment
- Manipulation of the independent variables — Artificially changing the variable that is being studied
- Measuring the effects of dependent variables — Measuring the outcomes of intervention precisely [3]
- Controlling of confounding variables — Removing other causes from the experiment
The strength of experimental research is that it can determine causation—that is, it not only answers questions of “what is occurring” and “are the variables correlated” but “is X causing Y?” Through its statistical strength, it allows research results to become valid business ventures. Proper sample size research is necessary to give experiments enough statistical power.
4. Causal-Comparative Research: Understanding Differences Between Groups
Causal-comparative research (also called ex post facto research) examines differences between pre-existing groups without researcher-controlled assignment to the groups. It can help identify associations that may warrant further investigation, but the design does not by itself establish causation. Quasi-experimental research is a broader category of designs that typically involves an intervention or exposure without random assignment.
Business Application:
A manufacturing company contrasts the productivity performance of sites applying lean management principles with sites utilizing traditional approaches. Even though the treatment of facilities is not random, a thorough statistical study considering the sizes of the facilities, the age of machinery, and the experience of employees clearly show that facilities utilizing lean management reported 19% higher efficiency after adjustment for measured differences in facility size, machinery age, and employee experience. Because the groups were not randomly assigned, this association should not be interpreted as definitive evidence that lean management caused the difference.
Characteristics of causal-comparative research:
- Comparison of pre-established groups – Utilizing already existing divisions instead of random assignments
- Lack of random assignment and manipulations of independent variables – Analyzing the natural effects of pre-existing differences
- Control of possible confounding variables through statistics – Employing analysis to control alternative possibilities
- Application of analytical tools to draw inference – Making sense of the data through analytical tools [1]
Such a method becomes extremely valuable when randomization is simply impossible or unethical. Causal-comparative designs can be used to examine differences associated with policies, structural changes, or business conditions when experimental manipulation or random assignment is not feasible. Findings should be interpreted cautiously because pre-existing group differences may contribute to the observed results.
Implementing Quantitative Research in Your Organization
Implementation of quantitative research methodologies is not only about methods and skills but also strategic planning and proper sample size study among others. Organizations that require corporate quantitative research services need to take advantage of:
- Well-defined research objectives in sync with business strategy — Making sure that every research is aimed at making decisions
- Choice of rigorous research designs for questions — Methodology matching research objectives
- Sample size that would provide enough data for a robust conclusion — Enough data for proper conclusion
- Proficient data analysis using advanced techniques — Appropriate application of statistics in practice [4]
- Reporting that leads to strategic decisions based on research results
In the best organizations, it is realized that quantitative data analysis services do not exist in isolation but rather form part of organizational strategy. The quality of insights obtained is dependent on the method of quantitative research used whether it is to establish baselines, correlations, interventions, or comparisons between groups.
A rigorous quantitative analysis should also assess whether the chosen statistical method meets its assumptions and whether the findings are practically meaningful. Depending on the study design, analysts may evaluate missing data, outliers, distributional assumptions, effect sizes, confidence intervals, statistical power, and potential confounding. A statistically significant result does not necessarily represent a meaningful business effect; interpretation should consider the magnitude and uncertainty of the estimate as well as the practical context
Why Organizations Choose to Outsource Quantitative Research
Organizations often outsource their quantitative research activities to specialist firms whenever they do not have sufficient internal expertise or when they need quick results. Quantitative data analysis services from professionals include:
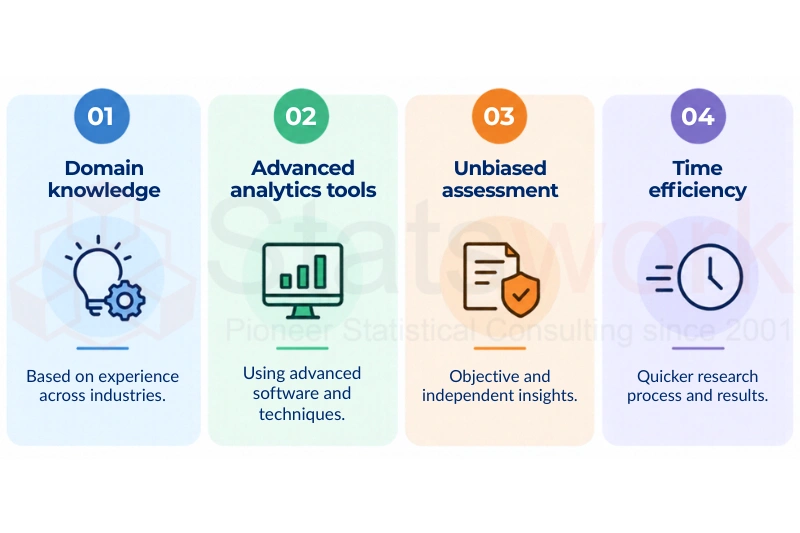
Corporate quantitative research services allow an organization to direct its internal efforts towards important strategic areas, while the specialists conduct methodologically sound research [4]. External quantitative research support can be useful when an organization lacks specialized statistical expertise, requires additional analytical capacity, or needs support with complex research designs. Depending on the project, specialists may assist with research design, data preparation, statistical analysis, interpretation, and reporting.
Conclusion: Building Data-Driven Organizations
Having knowledge of the key types of quantitative research methodologies is an important basis for making evidence-based decisions in contemporary business. Descriptive research can establish benchmarks and summarize patterns, correlational research can examine relationships between variables, experimental research can evaluate causal effects under appropriate conditions, and causal-comparative research can examine differences between pre-existing groups. Selecting the design that matches the research question helps organizations generate findings that are more appropriately interpreted and applied to business decisions [5].
Effective quantitative research can help organizations evaluate evidence systematically and make decisions with greater clarity about uncertainty, relationships, and potential effects. By proper types of research designs in their investigations and upholding statistical significance, they make data-driven decisions that lead to growth.
At Statswork, we combine deep methodological expertise with practical business acumen. Our corporate quantitative research services transform your research questions into actionable insights that drive real competitive advantage. Whether you’re establishing market baselines, validating strategic hypotheses, testing organizational changes, or comparing performance metrics across business units, our team applies rigorous quantitative research approaches tailored to your specific objectives.
Statswork supports quantitative research projects by aligning analytical methods with the research objective and providing structured statistical analysis and interpretation
Frequently Asked Questions (FAQs)
Quantitative research is commonly categorized into descriptive, correlational, causal-comparative, and experimental research, depending on the purpose and level of control over variables.
The main quantitative research approaches commonly include descriptive, correlational, experimental, and causal-comparative or other non-randomized designs. The appropriate approach depends on whether the objective is to describe patterns, examine associations, estimate causal effects, or compare pre-existing groups.
Quantitative, qualitative, and mixed-methods research are commonly described as broad research approaches. Specific research designs within these approaches vary according to the research question, data, level of researcher control, and study context.
The seven major types of research are basic, applied, quantitative, qualitative, mixed-methods, exploratory, and descriptive research.
The five main categories of research can be described as basic, applied, exploratory, descriptive, and explanatory research, based on their purpose and intended outcomes.
Seven basic research methods include surveys, experiments, interviews, observations, case studies, focus groups, and secondary data analysis.
References:
- Lim, W. M. (2025). What is quantitative research? An overview and guidelines. Australasian Marketing Journal, 33(3), 325-348. https://journals.sagepub.com/doi/
- Miller, C. E. (2025). Types of Quantitative Methods. Practical Quantitative Vibrational and Electronic Spectroscopy: A Guide for Developing, Optimizing, and Validating Procedures, 81-106. https://onlinelibrary.wiley.com/doi
- Gamage, A. (2025). Research design, philosophy, and quantitative approaches in scientific research methodology. Scholars Journal of Engineering https://d1wqtxts1xzle7.cloudfront.net/
- Shahid, S. U., Shabbir, T., & Shah, M. P. R. D. N. A. (2026). Mixed Methods Research Design: Integrating Qualitative and Quantitative Approaches in Social Science Inquiry. Journal of Social Signs Review, 4(6). https://www.socialsignsreivew.com
- Agni, K. C. (2025). Scope of Quantitative Research under Faculty of Education. BMC Research Journal, 4(1), 71-79. https://nepjol.info/index.php/bmcrj