Table 1: Descriptive statistics for factors.............................................................................................................................................................................2
Table 2: Friedman test for price, service quality staff competency, physical environment and Technology...........................................................2
Table 3: Kruskal Wallis test for price, service quality staff competency, physical environment and Technology for different segments..........2
As per instruction we have answered the Q12 based on template.
Table 1: Descriptive statistics for factors

Table 1 presents the descriptive statistics for the factors with reference to consumer perceived value (CPV). The physical environment factor ranked number one with the highest mean and standard deviation (Mean=7.01; SD=2.34). This is followed by price (Mean=6.76; SD=2.25, Rank II), service quality (Mean=6.56; SD=2.88, Rank III), staff competency (Mean=6.53; SD=2.25, Rank IV) and technology competency (Mean=6.20; SD=2.99, Rank V). Overall, table concludes that participants ranked physical environment, price and service quality as first three important factors.
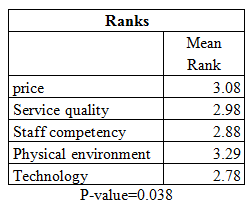
Table 2: Friedman test for price, service quality staff competency, physical environment and Technology

Friedman test was applied to identify the critical factors for consumer perceived value (CPV). Table 2 presents the findings of Friedman tests, which ranks customer perceived value according to their importance as recorded by survey participants. It is observed that ‘Physical environment’ ranked high by the survey participants with the mean ranking of 3.29. However, they ranked poor (low) for the factor ‘Technology competence’ with the mean rank of 2.78. While, the difference between these factors is significant, at p=0.038. Hence, it can be concluded that there is significant difference within the mean rank factors.
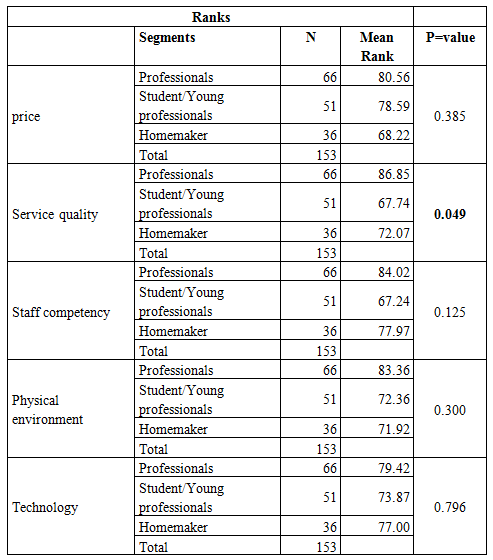
Table 3: Kruskal Wallis test for price, service quality staff competency, physical environment and Technology for different segments

The Kruskal-Wallis H test (sometimes also called the "one-way ANOVA on ranks") is a rank-based nonparametric test that can be used to determine if there are statistically significant differences between two or more groups of an independent variable on a continuous or ordinal dependent variable. It is considered the nonparametric alternative to the one-way ANOVA, and an extension of the Mann-Whitney U test to allow the comparison of more than two independent groups.
The mean rank (i.e., the "Mean Rank" column in the Ranks table) can be used to compare with different segments. A Kruskal-Wallis H test showed that there was a statistically significant (p = 0.049) difference in service quality across the segments (Mean rank of 86.85 for Professionals, 72.07 for Homemaker and 67.74 for Students/Young professionals). However, such difference was not observed for all other factors such as price, staff competency, physical environment and technology competency. This illustrates that there is a borderline difference in the service quality of the banks as perceived by different segments.
Tutoring: The following links would shed you light on how to calculate Kruskal Wallis test
1. https://www.sussex.ac.uk/Users/grahamh/RM1web/Kruskal-Wallis%20Handoout2011.pdf
2. https://www.real-statistics.com/one-way-analysis-of-variance-anova/kruskal-wallis-test/
3. https://www.real-statistics.com/one-way-analysis-of-variance-anova/kruskal-wallis-test/ (this is even clearer than two). However, based on your level understanding you can choose one to continue reading.


