
SEM Using AMOS – Guide to Structural Equation Modeling with AMOS
August 22, 2019
Analysis of variance (ANOVA)
August 28, 2019Factor Analysis – Definition, Methods & Applications | StatsWork
Meta Analysis Service
Recommended Reads
Contact us
Summary:
Factor analysis involves the statistical approach aimed at determining the underlying factors by grouping similar variables together into factors. This technique is normally applied to help validate constructs through surveys and decision-making process in both business organizations and academics. Common methods of factor analysis are exploration factor analysis (EFA) and confirmatory factor analysis (CFA). Some of the commonly used diagnostics for factor analysis include Kaiser-Meyer-Olkin Measure of Sampling Adequacy (KMO) and Bartlett’s Test. Some of the common applications of factor analysis include consumer satisfaction, employee motivation, market research, finance, and psychometrics among others using different software such as SPSS, R, Python, SAS, STATA, and Minitab.
Companies and researchers generate huge amounts of survey and operational data – opinions of customers, employee satisfaction metrics, financial data and market research answers. Hidden behind all these factors are certain fundamental patterns responsible for these outcomes [1]. Factor analysis is the statistical method used to uncover these patterns by transforming an obscure table of intercorrelated factors into a small number of interpretable dimensions.
The current guide explains everything there is to know about factor analysis, including how it works, what makes it different from other methods such as PCA and cluster analysis, what tests are required, methodology and practical examples of application in the business world.
What Is Factor Analysis?
Factor analysis is a method of reducing data through identification of a small number of latent variables or latent constructs which describe the correlation pattern between many observed variables. Rather than analyzing each of dozens of survey items individually, factor analysis bundles the relevant variables into a smaller number of dimensions [2].
For instance, if the questionnaire includes several items such as “friendly staff,” “fast service,” and “assistance,” then all those items will likely be describing the same construct of service quality. And factor analysis helps to mathematically confirm this intuition.
At its core, factor analysis uses a correlation matrix – this means that the algorithm analyzes how variables correlate with each other and extracts factors which account for their interrelationships. Relationship of each of the variables to a factor is represented in a factor matrix, while the share of variance of a particular variable which is accounted for by the extracted factors is called communality [3].
Types of Factor Analysis
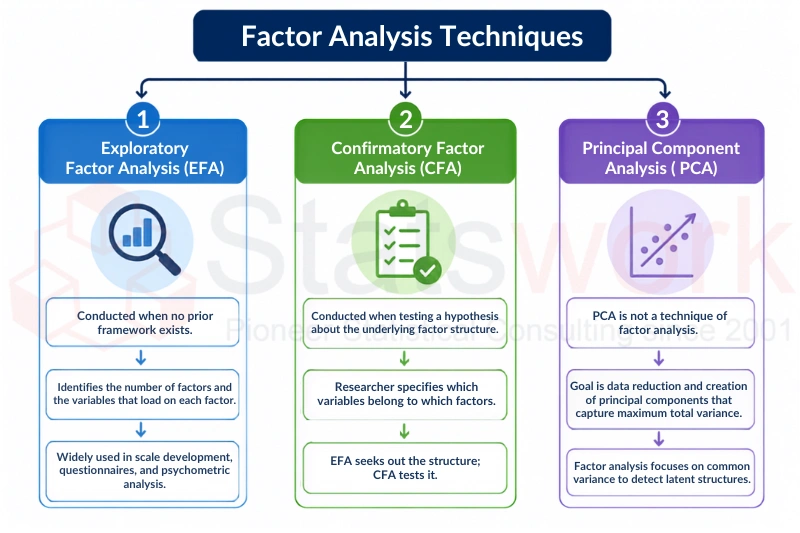
- Exploratory Factor Analysis (EFA)
Researchers conduct EFA when they do not have any prior framework in mind.
This analysis technique is utilized to determine the number of factors
present within a dataset and the variables that contribute to each factor.
EFA is widely used during the development of scales, questionnaires, and
psychometric analysis. - Confirmatory Factor Analysis (CFA)
Researchers conduct CFA when they need to assess the accuracy of their
hypothesis concerning the underlying factor structure of the given dataset.
CFA differs from EFA in that the researcher specifies which variables belong
to which factor during model specification. The key difference between EFA
and CFA is that EFA explores the underlying factor structure, whereas CFA
tests a predefined factor structure. - Principal Component Analysis (PCA)
The issue of factor analysis versus PCA emerges frequently; however, it is
important to note that PCA is not a type of factor analysis. The goal of PCA
is to reduce data dimensionality by creating principal components that
explain the maximum possible total variance, whereas factor analysis focuses
on the common variance among variables to identify latent structures
[4].
Key Assumptions and Diagnostic Tests
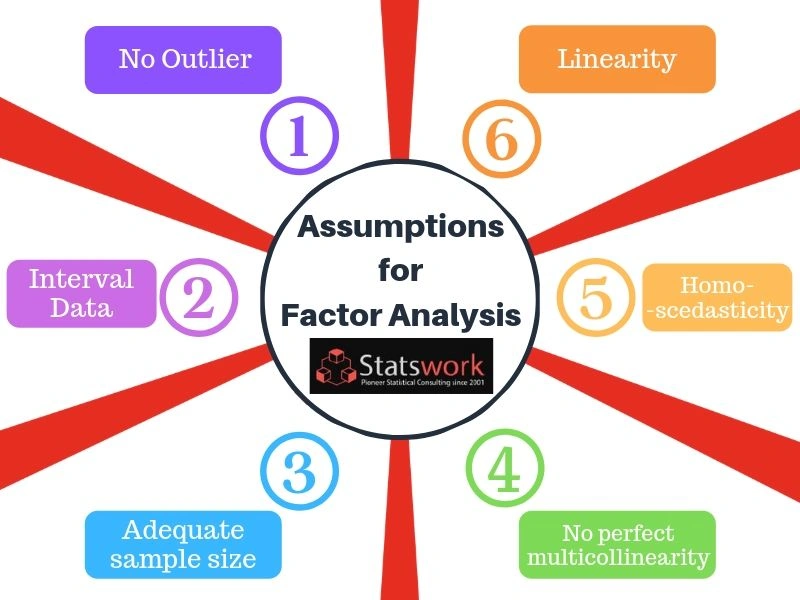
Certain conditions must be met before performing the factor analysis:
- Appropriate sample size in proportion to the variables
- Linearity between variables
- No presence of multicollinearity or singularity
The existence of sufficient correlation between variables to perform factor analysis
There are two important tests in this regard:
- KMO test (Kaiser-Meyer-Olkin Test): Evaluates sample adequacy. If the KMO test score is more than 0.6, then factor analysis is appropriate.
- Bartlett’s Test of Sphericity: Tests if the correlation matrix is significantly different from an identity matrix. If the p-value is less than 0.05, then the correlation exists and factoring of the variables can be performed.
The other condition which researchers must consider is multicollinearity because of extremely high correlation between the variables [2].
Step-by-Step Methods in Factor Analysis
Step 1: Extraction
The two extraction methods that are widely used are:
- Principal Axis Factoring: This approach is based on common variance between the variables and therefore is appropriate for extracting latent constructs.
- Maximum Likelihood Extraction: This approach can perform statistical significance testing of factor loadings and is suitable for normally distributed data.
Step 2: Determining Number of Factors
Determining number of factors is the most important step. The methods that can be used for this purpose include:
- Kaiser’s Criterion: Retains factors whose eigenvalues are higher than 1.
- Scree Plot: A graphic representation of eigenvalues to determine the point beyond which the factors do not have much explanatory value (“elbow”).
- Parallel Analysis: It involves comparison of eigenvalues from the original dataset with randomly generated eigenvalues; it is considered as the best method to determine number of factors.
Step 3: Rotation
When factors are extracted, rotation enhances their readability by making it clear what variables have higher weights in which factor.
- Orthogonal Rotation (like Varimax): It assumes that factors are uncorrelated, thus yielding neat loadings [3].
- Oblique Rotation (like Promax, Oblimin): Factors may correlate here as it makes more sense in social sciences and business studies where constructs do not exist in isolation from one another.
Decision about choosing between orthogonal and oblique rotation is supposed to depend on whether constructs under analysis are supposed to be correlated.
Step 4: Interpretation
Factors are interpreted by analysts who examine the factor matrix, look at loadings, and assign labels to factors based on the variables having the highest loadings into the factors.
Factor Analysis vs Other Statistical Techniques
| Technique | Purpose | Key Difference from Factor Analysis |
| PCA | Maximizes total variance explained | Doesn’t distinguish shared vs. unique variance |
| Cluster Analysis | Groups similar respondents or cases | Groups observations, not variables |
| Regression Analysis | Predicts a dependent variable from predictors | Tests relationships, doesn’t uncover latent structure |
| Conjoint Analysis | Measures preferences for product attributes | Focused on trade-off decisions, not underlying dimensions [2] |
Factor analysis and cluster analysis differences and factor analysis and regression analysis provide insight into choosing the appropriate technique as factor analysis focuses on variables and structure whereas cluster analysis focuses on dividing people or cases.
Business Applications of Factor Analysis
Factor analysis is used in many areas in market research, HR analytics, and financial risk management. Some examples of practical application of factor analysis are:
- Factor analysis of customer satisfaction survey: Reduction of many questions’ scores in a survey into basic factors that influence satisfaction levels, such as service quality, reliability of the product and its value for money.
- Factor analysis of market segmentation: Determination of preference factors before segmenting consumers according to their preferences.
- Factor analysis of survey design: Making sure that survey questions adequately measure the construct during scale development.
- Factor analysis of employee engagement: Reduction of questions in an employee engagement survey into basic themes like trust in leadership, organizational culture, and growth opportunities.
- Factor analysis of financial risk analysis: Determination of basic factors of risks existing in various financial measures to simplify portfolio and credit risk assessments [4].
- Perceptions and positioning: Determination of basic attributes influencing perceptions of the consumer about the brand compared to other brands.
These examples prove the importance of factor analysis in business decision making – factor analysis simplifies understanding and usage of huge amounts of survey and operation data.
Software Tools for Factor Analysis
Factor Analysis may be done using various statistical software platforms, including:
- Performing Factor Analysis using SPSS: This is the most widely used approach to performing factor analysis in academic and marketing research since it allows conducting EFA using an intuitive interface.
- Performing Factor Analysis using R: This software allows using packages such as ‘psych’, ‘lavaan’ for both EFA and CFA procedures and is preferred by many advanced researchers.
- Python (‘factor analyzer’): The increasingly popular way of implementing factor analysis for purposes of data science applications.
- STATA: Widely applied for factor analysis procedures in economic and social science research.
- SAS: Most widely applied in enterprise-level and pharmaceutical research.
- Minitab: Commonly used for quality improvement and Six Sigma analysis.
Conclusion
The method of factor analysis is undoubtedly the most robust among all the methods used to find the latent structure behind the data. From improving customer satisfaction surveys to creating models of employees’ engagement and psychometrics questionnaires, factor analysis is used extensively in all types of applications. Selecting the correct type of analysis, either EFA or CFA and choosing the appropriate extraction and rotation method can only be achieved through knowledge in statistics and application domain [3].
The statistician experts at StatsWork are adept at providing factor analysis services in its totality including testing assumptions like KMO and Bartlett’s test and selecting the correct extraction and rotation methods. Interpretation of data can be done using various software such as SPSS, R, Python, STATA, SAS or Minitab. Factor analysis outsourcing service can be used in many applications including market research projects, HR analysis and financial risk factors.
Contact StatsWork for any kind of factor analysis service that you require.
Frequently asked question:
The two primary methods of factor analysis are Exploratory Factor Analysis (EFA) and Confirmatory Factor Analysis (CFA). Researchers also use Principal Component Analysis (PCA) for data reduction, although it is not a true factor analysis method.
Factor analysis is a statistical technique used to identify underlying factors or latent variables that explain the relationships among multiple observed variables. It helps simplify complex datasets by grouping correlated variables into meaningful factors.
Factor analysis is widely used in psychology, healthcare, business, education, marketing, and social sciences to develop questionnaires, validate measurement scales, identify hidden patterns, and reduce data complexity.
The five-factor analysis typically refers to a model in which five underlying factors are extracted to explain the relationships among observed variables. The number of factors selected depends on statistical criteria and the objectives of the research.
The four main types of data analysis are descriptive analysis, diagnostic analysis, predictive analysis, and prescriptive analysis. Each type provides different levels of insight, from understanding past events to recommending future actions.
The four commonly recognized approaches related to factor analysis are Exploratory Factor Analysis (EFA), Confirmatory Factor Analysis (CFA), Principal Axis Factoring (PAF), and Maximum Likelihood Factor Analysis (MLFA). Each method serves different research objectives, from exploring data structures to testing theoretical models.
Reference:
- Laupichler, M. C., Aster, A., Haverkamp, N., & Raupach, T. (2023). Development of the “Scale for the assessment of non-experts’ AI literacy”–An exploratory factor analysis. Computers in Human Behavior Reports, 12, 100338. https://www.sciencedirect.com/science/article/pii/S2451958823000714
- McNeish, D., & Wolf, M. G. (2023). Dynamic fit index cutoffs for confirmatory factor analysis models. Psychological Methods, 28(1), 61. https://psycnet.apa.org/record/2021-98816-001
- Tehrani, F. S., Calvello, M., Liu, Z., Zhang, L., & Lacasse, S. (2022). Machine learning and landslide studies: recent advances and applications. Natural Hazards, 114(2), 1197-1245. https://link.springer.com/article/10.1007/s11069-022-05423-7
- Sürücü, L., Yıkılmaz, İ., & Maşlakçı, A. (2022). Exploratory factor analysis (EFA) in quantitative researches and practical considerations. Gümüşhane Üniversitesi Sağlık Bilimleri Dergisi, 13(2), 947-965. https://dergipark.org.tr/en/pub/gumussagbil/article/1183271
Contact us

Related posts