
Formulate statistical models (linear regression; logistic regression; factor analysis) using data from extensive social surveys.
March 26, 2020
Brief about the Statistical Application in Cell and Developmental Biology with an example
April 15, 2020Intelligent data analysis and visualization
Meta Analysis Service
Recommended Reads
Contact us
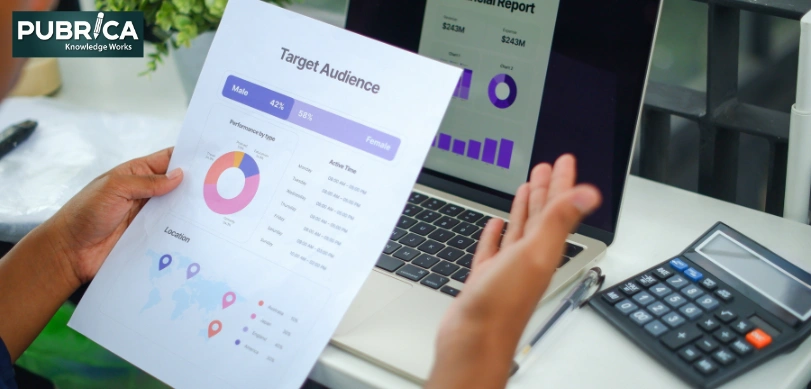
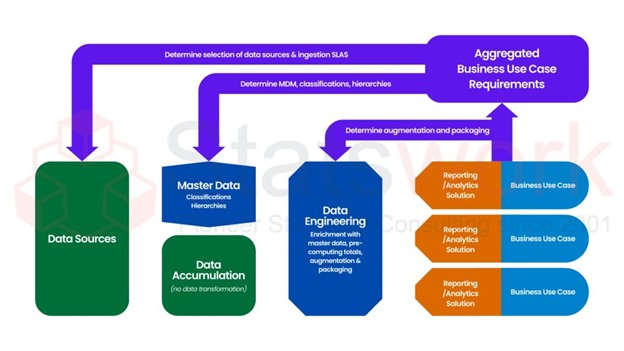
Intelligent data analysis and visualization
In any research field such as statistics, Clinical research, etc., data plays a vital role and analysing the data is utmost important task to provide evidence of the statement at hand. In addition to the Data Analysis, data visualization also equally important as it describes the characteristics of the data at first hand. In this blog, I will discuss about the intelligent data analysis and visualization. Before proceeding to the today’s topic, let me quickly explain what the data we mean and what we mean by a data analysis(Abdoos, Khorsand, and Yousefi 2014).
What is Data?
Data is nothing but the information collected through either numerical, or characters and from which the conclusions have been made.
What is Data Analysis?
Data analysis is the process of cleaning, transforming and modelling the data or information, which we gathered to discover useful insights towards the problem statement. The purpose of data analysis is to look for useful information as data and identify what the data is trying to tell us. Researchers often analyse the data to identify any relationship between the variables or to identify the pattern in the data. Later, with the advancement of computer technologies, researchers make use of simulated models from the sample data to predict future outcomes.
Now, the next step is to understand the purpose of Data Visualization. In general, data visualization is the process of representing the existing or gathered data in the form of tables and charts. Usually summary statistics or the Descriptive statistics are used to understand the characteristics of the data. However, we may miss something about the data suppose in the case of skewed data. In such case, visualization of the data helps the researcher to look for all the characteristics of the collected data extensively. Data visualizing is also an form of data analysis since it helps the analyst to conducFt the main analysis such as classification, modelling, etc. In addition, it acts as a precursor to any data analysis and it is easier to communicate to the audience without any knowledge about this(Keim and Ward 2007).
Now let us come to Intelligent Data Analysis or simply IDA. Intelligent data analysis reveals the hidden factors that are unknown earlier and provides useful and important information from huge amount of data and make proper decisions; and IDA is one of the major problem in the field of Artificial Intelligence. Apart from AI or Artificial Intelligence, IDA make use of the data to make right decisions in techniques such as machine learning, pattern recognition and visualization, etc.
IDA is something like an iterative process or like a Newton Raphson methodology, that is, in every iteration the data gets updated and used for arriving the conclusions. In other words, IDA analyse the data which are collected from the past and accumulate the findings from the final result we got and revise that with the present strategy for getting the conclusion.
The process of intelligent data analysis consists of three steps. First is the preparation of the data, then Data Mining, and finally interpreting or validating the data. IDA is similar to usual data analysis but it considers the data from the past and conclude the result for present situation. Like the usual data analysis, selecting the optimum or suitable methodology is the challenging one if there exists complexity of the process(Tian et al. 2014).
Data analysis is not necessarily involve the math or stats, it can even be handled without them. The vital task of most of the data analysis is the comparison of methods or two datasets. Every data analysis starts from the collection of data related to the research topic and the duty to the analyst is to organise the data in a proper manner and identify the useful information from the data through statistical or mathematical models(White 2008).
Visualization is an interesting part of any data analysis and is otherwise termed as charting the data. The main idea of visualizing the data is to present the information in a graphical or visual form allowing other people to understand it easily and make conclusions for their business problems(Jiawei Han, Pei, and Kamber 2011). Visualizing the data is often used in exploratory data analysis. It can easily identify the homogeneity or heterogeneity in the data sets. The advantage of visual data analysis is that it does not require any knowledge of any mathematical or statistical algorithms. As I mentioned earlier, it helps the analyst to proceed for the further analysis(Pur et al. 2007).
In conclusion, in the current data centric world with vast amount of datasets, it is often a challenging task to identify the significance in the data analysis. In such case, visualization of the data is helpful in solving many complex problems. In addition, intelligent data analysis make use of the prior knowledge about the data and provide better results using data mining techniques than the usual data analysis. Visualising the data using data mining technique is much more appropriate method for finding the accurate results of the data. Further, the visualization of the data presents a qualitative nature of the data which lead to conduct the Quantitative data investigations. Even if the data analysis yield incorrect conclusion, the visual examination is helpful to identify the correct results(V Batagelj 2006).
References
- Abdoos, H., H. Khorsand, and A. A. Yousefi. 2014. “Torque Rheometry and Rheological Analysis of Powder–polymer Mixture for Aluminum Powder Injection Molding.” Iranian Polymer Journal 23(10): 745–55. https://link.springer.com/content/
- Jiawei Han, Jian Pei, and Micheline Kamber. 2011. Data Mining: Concepts and Techniques. https://scholar.google.com/citations