

What are the different methodological advancements in productivity and efficiency analysis?
In-Brief
- First performance needs to be measured to recognize the best practice. There are a variety of tools found to calculate the Productivity and Efficiency Analysis. One such tool is data envelopment analysis (DEA).
- There are many factors not under the control of the distribution centre that affects efficiency. Some examples could be the weather, market conditions, and other companies’ competitive behaviour.
Introduction
The term productivity growth is frequently mentioned in the business community, politicians and media commentators to improve the living standards. Yet, it isn’t easy to figure out what productivity means. It differs from field to field, from an economist’s point of view. It is the efficiency with which businesses, organizations, industry, and the economy as a whole, convert inputs (labour, capital, and raw materials) into output. It grows when output grows faster than inputs, which cause the present input more productively efficient. It does not support to reflect how much we value the outputs, but it only helps to measures how efficiently we use our resources to produce them.
Measuring productivity growth
A productivity measure is the ratio of a measure of total outputs to a measure of inputs used to produce goods and services. It is evaluated by subtracting the progress in inputs from the output growth — it is the residual.
There are several ways found to measure productive efficiency analysis for statistics. Some of them are
- multifactor productivity (MFP): Which evaluates the development in value-added output (real gross output less intermediate inputs) found per unit of labour and capital input used; and
- Labour productivity (LP): This evaluates the growth in value-added output per unit of labour used.
The evaluating of MFP with the help of the traditional accounting methods needs independent inputs and outputs. Economy-wide MFP estimations replicate productivity growth which found only 80 per cent of the budget (the share of the 16 businesses in total GDP). LP can be calculated for both the market and non-market sectors of the economy. It is because labour input can be estimated in actual volume terms as hours worked. MFP is closer to the concept of productive efficiency than LP as it removes the contribution of capital deepening from the residual.
Various productivity and efficiency analysis methods
Defining terminology
The term decision-making unit (DMU), statement and firm used interchangeably to mean a group member for which efficiency is being calculated. The input and output of DMU will be as follow
Input – human, physical or financial sources which are put into a system to attain a result. Output – Any outcome, product, or service which a system yields. Productivity and Efficiency Data Analysis can be represented stated as,
Productivity expresses a ratio of outputs manufactured to inputs consumed. In case of multiple inputs or multiple outputs, productivity can be conveyed either as a single ratio or as a set of ratios, in which case a technique for aggregating inputs and outputs must be specified.
Efficiency is a measure of performance related to some reference value. The main difference found in-between productivity and efficiency is that productivity for a DMU can be calculated without any references (to any other DMU). At the same time efficiency is a ratio of productivity concerning an efficient frontier.
An efficient frontier is described as the correspondence between input and output bundles when a DMU operates at the “best case” productivity level. If you found difficult with statistical analysis
you can get Data Analysis services help from online providers.
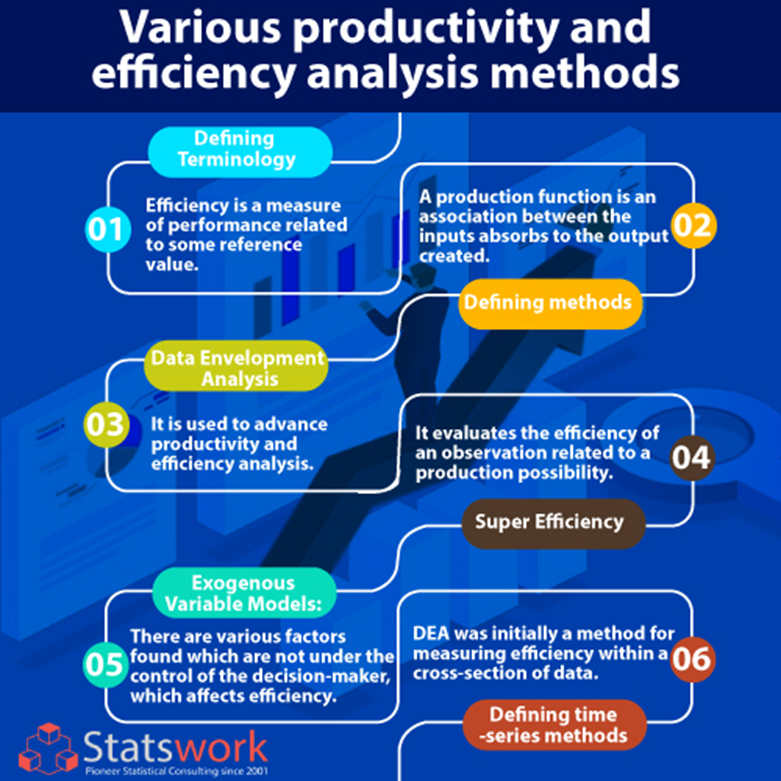
Defining methods
A production function is an association between the inputs absorbs to the output created with an allowance for a mistake in the measurement or random performance.
y = f(x,β) + ε
where y represent single output, x represents the vector of inputs, β are factors predicted based on a primary data set, and ε represent the residual error terms. The function f ( ) can take various forms.
Data Envelopment Analysis
DEA is an easily understood method, which can be used to advance productivity and efficiency analysis. For every DMU a measure of the proportion of weighted outputs over-weighted inputs is evaluated,
For example:
u‘yi/v‘xi
where u represents the Q×1 vector of output weights, and v represent P×1 vector of input weights, and u′ is the result of the transpose of u. Consider the condition in which numerous DMUs place various levels of significance on certain inputs and outputs. Then the weights u and v would become specific to each DMU. DEA chose, for each DMU, the set of weights that increases the estimate of that DMU’s efficiency by resolving the following
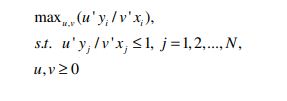
u‘yi/v‘xi
An efficiency measure for DMU. The mathematical program maximizes the ith DMU’s efficiency subject to the constraint all efficiency measures must be less than or equal to one. This model is then solved once for each DMU.
Super Efficiency
This approach evaluates the efficiency of an observation related to a production possibility set created from a set of examinations that do not incorporate the observation under analysis. Generally, DEA input focuses on the efficiency estimates that range from zero to one; however, when the observation under analysis is not used in determining the production possibility set, this is no longer the case. When the observation found outside the production possibility set, the efficiency estimates might be greater than one. Super efficiencies estimations can be evaluated with the help of the DEA linear program.
Exogenous Variable Models
There are various factors found which are not under the control of the decision-maker, which affects efficiency. They are termed as exogenous or environmental variables. Some examples of environmental variables could be market conditions, weather and other businesses’ competitive activities. These types of variables are exogenous for both the short-run and the long-run problem. However, decisions made for the long-run plan that once made become exogenous variables to the short-run problem such as space or investment decisions.
Defining time-series methods
DEA was initially a method for measuring efficiency within a cross-section of data. However, it is often interesting not only to compare data across groups of firms but also to compare efficiency changes. Cross-sectional data available at several points in time is called panel data.
Conclusion
Statistics for business analysis Specialization is designed to equip you with a basic understanding of business data analysis tools and techniques. Productivity is the single most significant factor in determining profitability and living standards in the long run. It combines the inputs and outputs with modelling frameworks based on the economic theory of production to produce efficiency and productivity change estimates. You can get advanced statistical analysis research and company Data collection services from experts to get a perfect analysis.
References
- Johnson, A. (2006). Methods in productivity and efficiency analysis with applications to warehousing (Doctoral dissertation, Georgia Institute of Technology).
- Jayamaha, A., & Mula, J. M. (2011). Productivity and efficiency measurement techniques:: identifying the efficacy of techniques for financial institutions in developing countries. Journal of Emerging Trends in Economics and Management Sciences, 2(5), 454-460.
 Previous Post
 Next Post