

Why framing research question and storyboard development is important before analyses?
In-brief
- The drawing of action into graphical appearance is a way of shortening and bringing transparency to concepts.
- Although the engineering-based approach connects to plan in various ways, the storyboards not only connect to frame methods, it is in itself a design, both as a procedure and as an outcome.
- Statistical analysis in research methodology involved in carrying out a study includes planning, designing, collecting data, analyzing, drawing meaningful interpretation, and reporting the research findings.
Introduction
The storyboard is a way of organizing an explanation and its substances, images and words. It helps the film industry, by creating a visual manifestation of verbal story and understanding the whole story by going from the abstract to concrete. While using the storyboard, the Key is to discover the scene’s visual appearance and identify what kinds of problems have to be solved before understanding the concept. The drawing of action into graphical appearance is a way of shortening and bringing transparency to concepts. While working with case studies, multiple confirmation resources are often used to gain different viewpoints on analysis.
General sources of evidence are interviews, archive material or surveys, direct observation, and physical artefacts. The selection of the method to gather data is significant in case study research. Since the research project aims to improve the design and visualization approaches to be used in the industry’s innovation and product recognition processes, the objective is to find a trusted method for data collection related to your research field. The approach must give both a graphical and a verbal explanation of the invention’s current situation, and product recognition process in the businesses studied. Storyboard satisfies our demands for Statistical analysis in business research.
Moreover, a hypothesis was that visualization as early as when describing the existing situation could provide data about how a visualization method can describe advance and product realization project in retrospective. In the companies’ studies, product realization projects were used as the base for the storyboarding workshop.
Objectives and research questions
Any actual research projects aim to contribute to the organization in implementing plans and approaches to imprisonment “lesson learned” in previous projects and use previous experiences to avoid repeating mistakes. It is an alternative method for describing the flow in the institute. Although the engineering-based approach connects to plan in various ways, the storyboards not only connect to frame methods, it is in itself a design, both as a procedure and as an outcome. When carefully analyzing the method of storyboarding, it appears conceivable to maximize the study of research planning services’ internal validity.
Internal legitimacy establishes that certain situations lead to other conditions. It needs multiple pieces of confirmation from various resources to discover a concurrent line of analysis. It also ensures that the approaches used are well-documented and can be repeated. The aim is to discuss storyboard as an approach for capturing experience from completed product realization projects of statistical analysis research proposal.
The two major queries (a) Can storyboard be used as a technique for catching experiences from previous projects in the manufacturing industry? And,
(b) If so, what does the method suggest to the manufacturing industry? This paper aims to answer both questions and analyze the outcomes from a narrative theory perception concerning contemporary cognitive models concerning how external representations (i.e., sketches) facilitate collaborative work; in this actual case, that work is a rebuilding of a product realization process. Research design statistical analysis help provides the best analysis help for your research work.
Why storyboarding also helps in doing research.
Implementation of a research project, or doing a PhD, may appear far from creative film- or video-making? Why should a technique from such a distant line of activity be beneficial to scholars, scientists and academics?
Visualizing your final product is also priceless in research contexts and storyboarding again helps here. The benefits for scientists and academics include:
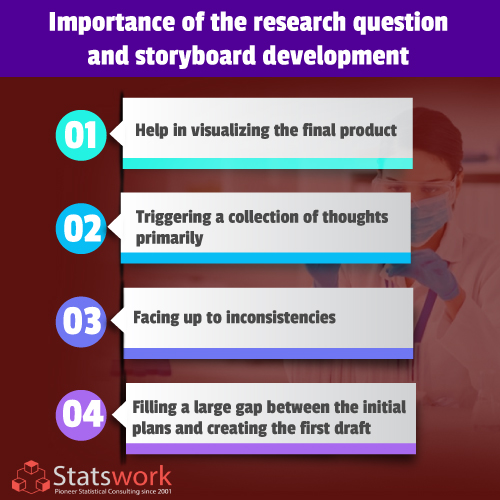
Triggering a collection of thoughts primarily sufficient to support shape the research process, rather than just unanswered questions left hanging in the ‘writing up’. One paragraph tends to recommend another, perhaps an imaginable counterargument, and that in turn may recommend a rebuttal argument. None of this will be known before the starting paragraph gets written. Similarly, looking hard at an accomplished chart or table nearly always reveals patterns (or possible interpretations) emphasizing a need for another chart or table in statistical plans for research methodology.
Facing up to inconsistencies: Everyone will have some contradictory ideas or arguments in their mind or even in oral descriptions and conversations. Writing out opinions or otherwise visualizing results or deliverables in concrete ways, helps counteract maintaining unpredictable guarantees and arguments. Obligating ideas to screen or to paper forces you to face up to weaknesses, refine arguments to evade difficulties, or fashion counter-responses or possible solutions for things that seem to clash.
- Focusing on a research narrative, early on. Although a storyboard must include critical, substantive details, it also emphases getting overall messages in a reachable way. For a scientific research project, article or PhD chapter a storyboard guides your attention ceaselessly to the research’s value-added, the key discoveries and conclusions, make the ‘bottommost line’ argument.
Fill a large gap between the initial plans and create a first draft of the research report, document or article. Filling the large gap between original plans and creating an initial draft of the document, article or section. Storyboarding helps in visualizing research questions and Research Planning Services. With the following, If all things went well as expected, what would find out or end up arguing? Or what if things went wrong in the sense of diverse lot from the initial expected plan? Or showing that I do not understand what was going on? Or things are more complicated than you thought?, are there any intermediate outputs, findings or results that I can bank for sure?.
Conclusion
Statistical analysis in research methodology involved in carrying out a study includes planning, designing, collecting data, analyzing, drawing meaningful interpretation, and reporting the research findings. Stats work explains the drawing of action into graphical appearance to shorten and bring transparency to concepts.
Reference
- Wikström, A., Everskog, A., Forsberg Wallin, A., Hyltefors, M., Larsen, S., & Verganti, R. (2013). Storyboarding-Framing the” frame” of opportunity. In DS 75-7: Proceedings of the 19th International Conference on Engineering Design (ICED13), Design for Harmonies, Vol. 7: Human Behaviour in Design, Seoul, Korea, 19-22.08. 2013 (pp. 267-276).
- Truong, K. N., Hayes, G. R., & Abowd, G. D. (2006, June). Storyboarding: an empirical determination of best practices and effective guidelines. In Proceedings of the 6th conference on Designing Interactive systems (pp. 12-21).
 Previous Post
 Next Post